

280
13 Computer-Aided Wind Tunnel Test and Analysis
the fuselage, the wing, the nacelle, the pylon, the model support, etc. The user can
thus examine the influence of the support on each component starting from pre-test
calculations. Thus, before even manufacturing the model and the supports, the digital
wind tunnel allows evaluation of the effects of the supports on the flow around the
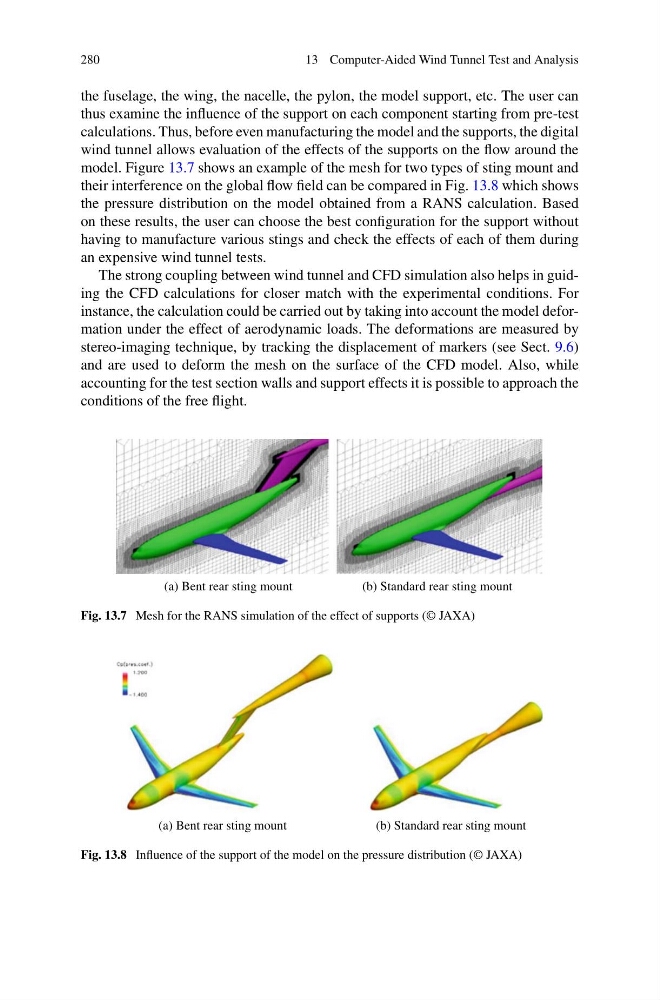
model. Figure 13.7 shows an example of the mesh for two types of sting mount and
their interference on the global flow field can be compared in Fig. 13.8 which shows
the pressure distribution on the model obtained from a RANS calculation. Based
on these results, the user can choose the best configuration for the support without
having to manufacture various stings and check the effects of each of them during
an expensive wind tunnel tests.
The strong coupling between wind tunnel and CFD simulation also helps in guiding the CFD calculations for closer match with the experimental conditions. For
instance, the calculation could be carried out by taking into account the model deformation under the effect of aerodynamic loads. The deformations are measured by
stereo-imaging technique, by tracking the displacement of markers (see Sect. 9.6)
and are used to deform the mesh on the surface of the CFD model. Also, while
accounting for the test section walls and support effects it is possible to approach the
conditions of the free flight.
(a) Bent rear sting mount
(b) Standard rear sting mount
Fig. 13.7 Mesh for the RANS simulation of the effect of supports (© JAXA)
(a) Bent rear sting mount
(b) Standard rear sting mount
Fig. 13.8 Influence of the support of the model on the pressure distribution (© JAXA)
13 Computer-Aided Wind Tunnel Test and Analysis
the fuselage, the wing, the nacelle, the pylon, the model support, etc. The user can
thus examine the influence of the support on each component starting from pre-test
calculations. Thus, before even manufacturing the model and the supports, the digital
wind tunnel allows evaluation of the effects of the supports on the flow around the
model. Figure 13.7 shows an example of the mesh for two types of sting mount and
their interference on the global flow field can be compared in Fig. 13.8 which shows
the pressure distribution on the model obtained from a RANS calculation. Based
on these results, the user can choose the best configuration for the support without
having to manufacture various stings and check the effects of each of them during
an expensive wind tunnel tests.
The strong coupling between wind tunnel and CFD simulation also helps in guiding the CFD calculations for closer match with the experimental conditions. For
instance, the calculation could be carried out by taking into account the model deformation under the effect of aerodynamic loads. The deformations are measured by
stereo-imaging technique, by tracking the displacement of markers (see Sect. 9.6)
and are used to deform the mesh on the surface of the CFD model. Also, while
accounting for the test section walls and support effects it is possible to approach the
conditions of the free flight.
(a) Bent rear sting mount
(b) Standard rear sting mount
Fig. 13.7 Mesh for the RANS simulation of the effect of supports (© JAXA)
(a) Bent rear sting mount
(b) Standard rear sting mount
Fig. 13.8 Influence of the support of the model on the pressure distribution (© JAXA)