

272
12 Laser Spectroscopy and Electron Beam Excitation
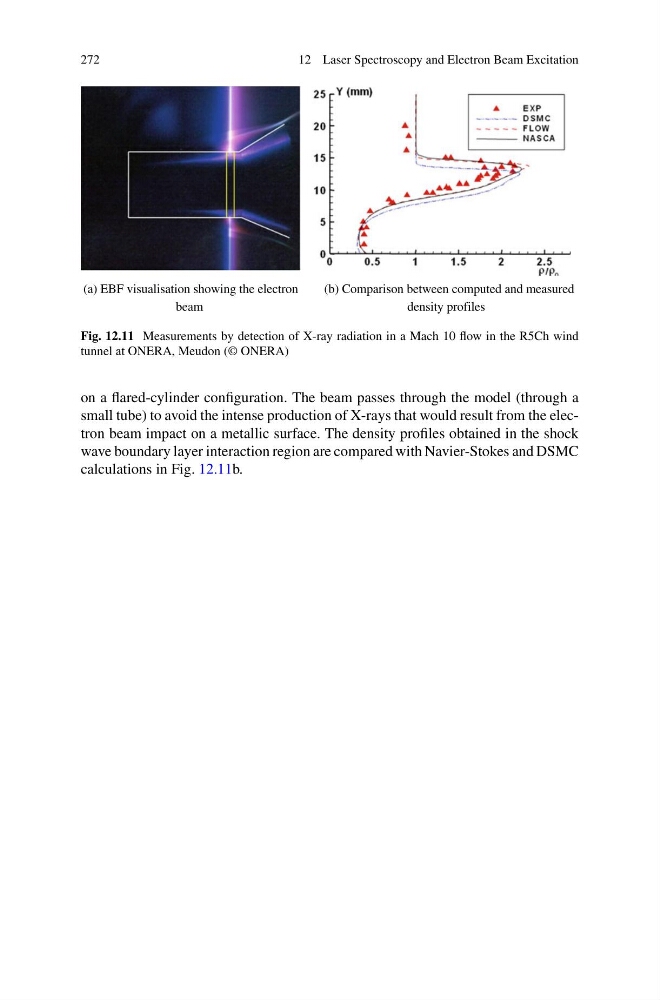
(a) EBF visualisation showing the electron
beam
(b) Comparison between computed and measured
density profiles
Fig. 12.11 Measurements by detection of X-ray radiation in a Mach 10 flow in the R5Ch wind
tunnel at ONERA, Meudon (© ONERA)
on a flared-cylinder configuration. The beam passes through the model (through a
small tube) to avoid the intense production of X-rays that would result from the electron beam impact on a metallic surface. The density profiles obtained in the shock
wave boundary layer interaction region are compared with Navier-Stokes and DSMC
calculations in Fig. 12.11b.
12 Laser Spectroscopy and Electron Beam Excitation
(a) EBF visualisation showing the electron
beam
(b) Comparison between computed and measured
density profiles
Fig. 12.11 Measurements by detection of X-ray radiation in a Mach 10 flow in the R5Ch wind
tunnel at ONERA, Meudon (© ONERA)
on a flared-cylinder configuration. The beam passes through the model (through a
small tube) to avoid the intense production of X-rays that would result from the electron beam impact on a metallic surface. The density profiles obtained in the shock
wave boundary layer interaction region are compared with Navier-Stokes and DSMC
calculations in Fig. 12.11b.