

178
7 Flow Visualisation Techniques
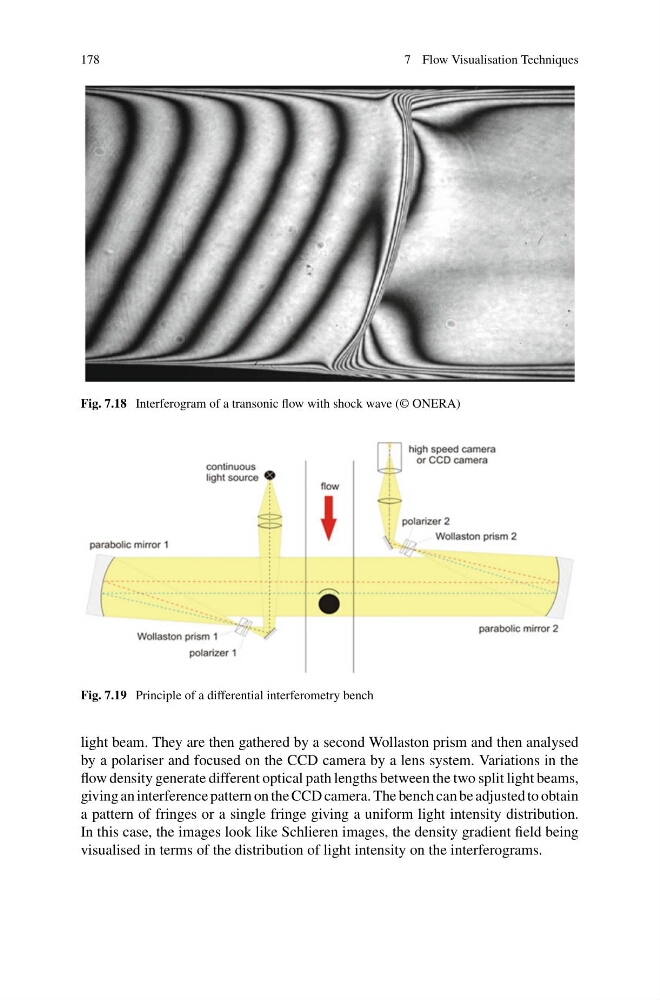
Fig. 7.18 Interferogram of a transonic flow with shock wave (© ONERA)
Fig. 7.19 Principle of a differential interferometry bench
light beam. They are then gathered by a second Wollaston prism and then analysed
by a polariser and focused on the CCD camera by a lens system. Variations in the
flow density generate different optical path lengths between the two split light beams,
giving an interference pattern on the CCD camera. The bench can be adjusted to obtain
a pattern of fringes or a single fringe giving a uniform light intensity distribution.
In this case, the images look like Schlieren images, the density gradient field being
visualised in terms of the distribution of light intensity on the interferograms.
7 Flow Visualisation Techniques
Fig. 7.18 Interferogram of a transonic flow with shock wave (© ONERA)
Fig. 7.19 Principle of a differential interferometry bench
light beam. They are then gathered by a second Wollaston prism and then analysed
by a polariser and focused on the CCD camera by a lens system. Variations in the
flow density generate different optical path lengths between the two split light beams,
giving an interference pattern on the CCD camera. The bench can be adjusted to obtain
a pattern of fringes or a single fringe giving a uniform light intensity distribution.
In this case, the images look like Schlieren images, the density gradient field being
visualised in terms of the distribution of light intensity on the interferograms.