

172
7 Flow Visualisation Techniques
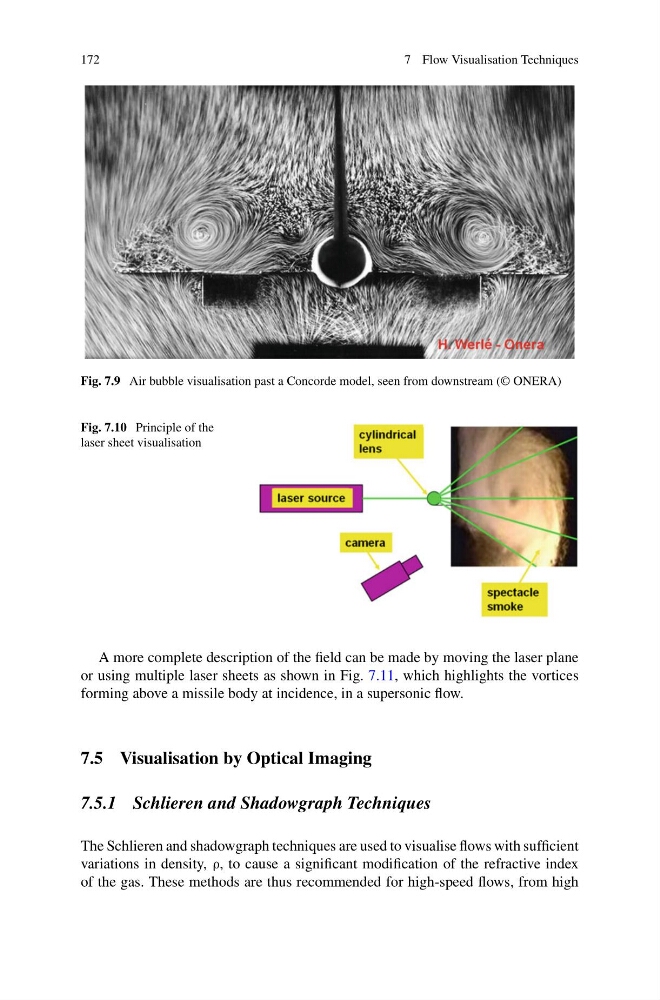
Fig. 7.9 Air bubble visualisation past a Concorde model, seen from downstream (© ONERA)
Fig. 7.10 Principle of the
laser sheet visualisation
A more complete description of the field can be made by moving the laser plane
or using multiple laser sheets as shown in Fig. 7.11, which highlights the vortices
forming above a missile body at incidence, in a supersonic flow.
7.5 Visualisation by Optical Imaging
7.5.1 Schlieren and Shadowgraph Techniques
The Schlieren and shadowgraph techniques are used to visualise flows with sufficient
variations in density, ρ, to cause a significant modification of the refractive index
of the gas. These methods are thus recommended for high-speed flows, from high
7 Flow Visualisation Techniques
Fig. 7.9 Air bubble visualisation past a Concorde model, seen from downstream (© ONERA)
Fig. 7.10 Principle of the
laser sheet visualisation
A more complete description of the field can be made by moving the laser plane
or using multiple laser sheets as shown in Fig. 7.11, which highlights the vortices
forming above a missile body at incidence, in a supersonic flow.
7.5 Visualisation by Optical Imaging
7.5.1 Schlieren and Shadowgraph Techniques
The Schlieren and shadowgraph techniques are used to visualise flows with sufficient
variations in density, ρ, to cause a significant modification of the refractive index
of the gas. These methods are thus recommended for high-speed flows, from high