

4.2 Blockage Reduction and Flow Un-Chocking
101
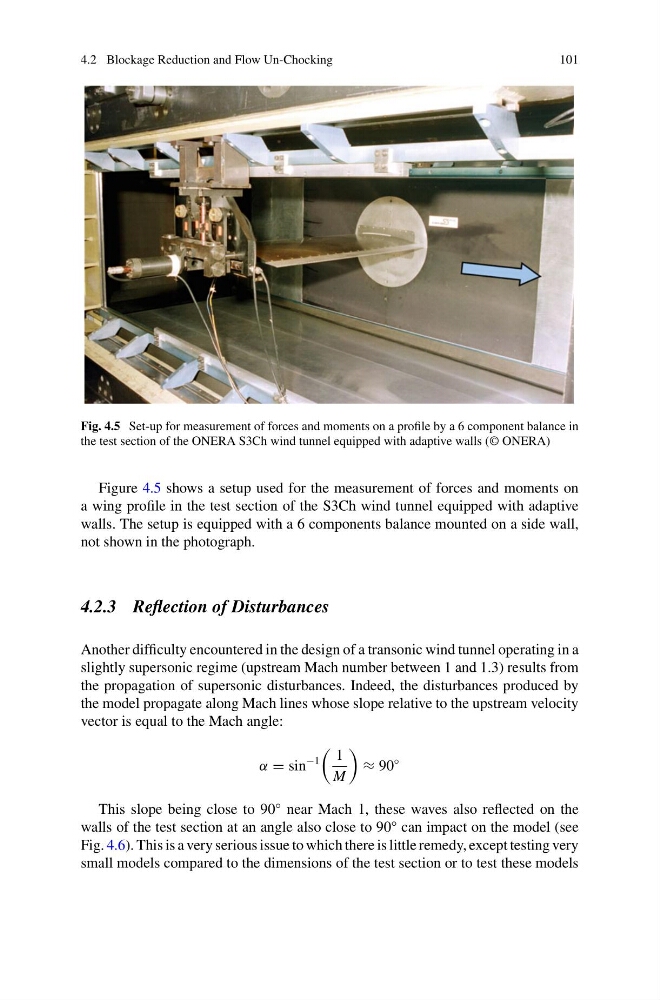
Fig. 4.5 Set-up for measurement of forces and moments on a profile by a 6 component balance in
the test section of the ONERA S3Ch wind tunnel equipped with adaptive walls (© ONERA)
Figure 4.5 shows a setup used for the measurement of forces and moments on
a wing profile in the test section of the S3Ch wind tunnel equipped with adaptive
walls. The setup is equipped with a 6 components balance mounted on a side wall,
not shown in the photograph.
4.2.3 Reflection of Disturbances
Another difficulty encountered in the design of a transonic wind tunnel operating in a
slightly supersonic regime (upstream Mach number between 1 and 1.3) results from
the propagation of supersonic disturbances. Indeed, the disturbances produced by
the model propagate along Mach lines whose slope relative to the upstream velocity
vector is equal to the Mach angle:
α = sin
−1
1
M
≈ 90
◦
This slope being close to 90° near Mach 1, these waves also reflected on the
walls of the test section at an angle also close to 90° can impact on the model (see
Fig. 4.6). This is a very serious issue to which there is little remedy, except testing very
small models compared to the dimensions of the test section or to test these models
101
Fig. 4.5 Set-up for measurement of forces and moments on a profile by a 6 component balance in
the test section of the ONERA S3Ch wind tunnel equipped with adaptive walls (© ONERA)
Figure 4.5 shows a setup used for the measurement of forces and moments on
a wing profile in the test section of the S3Ch wind tunnel equipped with adaptive
walls. The setup is equipped with a 6 components balance mounted on a side wall,
not shown in the photograph.
4.2.3 Reflection of Disturbances
Another difficulty encountered in the design of a transonic wind tunnel operating in a
slightly supersonic regime (upstream Mach number between 1 and 1.3) results from
the propagation of supersonic disturbances. Indeed, the disturbances produced by
the model propagate along Mach lines whose slope relative to the upstream velocity
vector is equal to the Mach angle:
α = sin
−1
1
M
≈ 90
◦
This slope being close to 90° near Mach 1, these waves also reflected on the
walls of the test section at an angle also close to 90° can impact on the model (see
Fig. 4.6). This is a very serious issue to which there is little remedy, except testing very
small models compared to the dimensions of the test section or to test these models