

66
S. Kerbstadt et al.
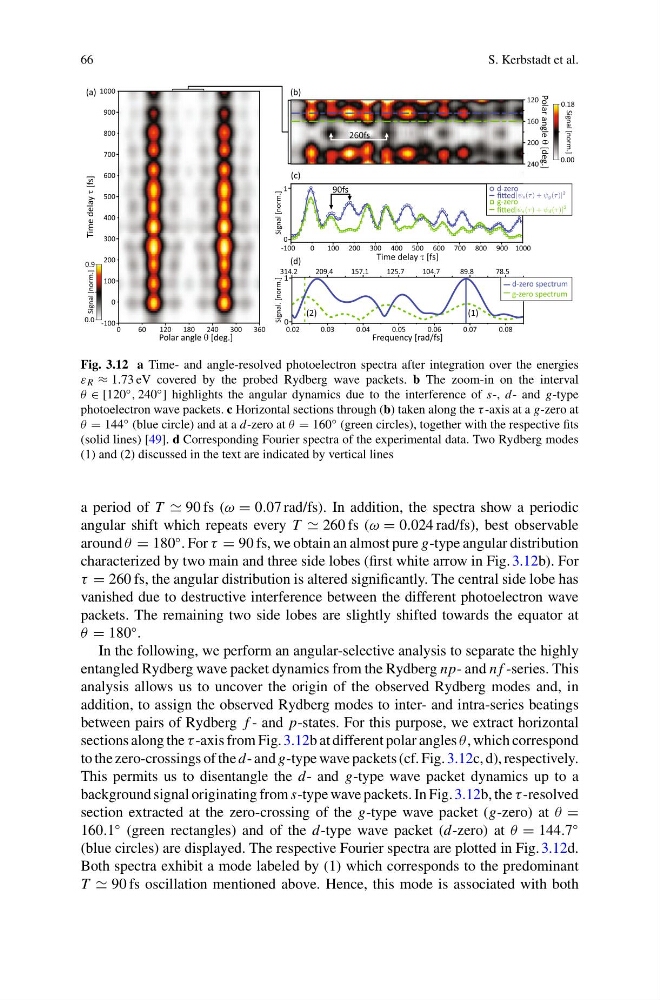
Fig. 3.12 a Time- and angle-resolved photoelectron spectra after integration over the energies
ε R ≈ 1.73 eV covered by the probed Rydberg wave packets. b The zoom-in on the interval
θ ∈ [120 ◦ , 240 ◦ ] highlights the angular dynamics due to the interference of s-, d- and g-type
photoelectron wave packets. c Horizontal sections through (b) taken along the τ -axis at a g-zero at
θ = 144 ◦ (blue circle) and at a d-zero at θ = 160 ◦ (green circles), together with the respective fits
(solid lines) [49]. d Corresponding Fourier spectra of the experimental data. Two Rydberg modes
(1) and (2) discussed in the text are indicated by vertical lines
a period of T 90 fs (ω = 0.07 rad/fs). In addition, the spectra show a periodic
angular shift which repeats every T 260 fs (ω = 0.024 rad/fs), best observable
around θ = 180
◦ . For τ = 90 fs, we obtain an almost pure g-type angular distribution
characterized by two main and three side lobes (first white arrow in Fig. 3.12b). For
τ = 260 fs, the angular distribution is altered significantly. The central side lobe has
vanished due to destructive interference between the different photoelectron wave
packets. The remaining two side lobes are slightly shifted towards the equator at
θ = 180
◦ .
In the following, we perform an angular-selective analysis to separate the highly
entangled Rydberg wave packet dynamics from the Rydberg np- and n f -series. This
analysis allows us to uncover the origin of the observed Rydberg modes and, in
addition, to assign the observed Rydberg modes to inter- and intra-series beatings
between pairs of Rydberg f - and p-states. For this purpose, we extract horizontal
sections along the τ -axis from Fig. 3.12b at different polar angles θ , which correspond
to the zero-crossings of the d- and g-type wave packets (cf. Fig. 3.12c, d), respectively.
This permits us to disentangle the d- and g-type wave packet dynamics up to a
background signal originating from s-type wave packets. In Fig. 3.12b, the τ -resolved
section extracted at the zero-crossing of the g-type wave packet (g-zero) at θ =
160.1
◦ (green rectangles) and of the d-type wave packet (d-zero) at θ = 144.7
◦
(blue circles) are displayed. The respective Fourier spectra are plotted in Fig. 3.12d.
Both spectra exhibit a mode labeled by (1) which corresponds to the predominant
T 90 fs oscillation mentioned above. Hence, this mode is associated with both
S. Kerbstadt et al.
Fig. 3.12 a Time- and angle-resolved photoelectron spectra after integration over the energies
ε R ≈ 1.73 eV covered by the probed Rydberg wave packets. b The zoom-in on the interval
θ ∈ [120 ◦ , 240 ◦ ] highlights the angular dynamics due to the interference of s-, d- and g-type
photoelectron wave packets. c Horizontal sections through (b) taken along the τ -axis at a g-zero at
θ = 144 ◦ (blue circle) and at a d-zero at θ = 160 ◦ (green circles), together with the respective fits
(solid lines) [49]. d Corresponding Fourier spectra of the experimental data. Two Rydberg modes
(1) and (2) discussed in the text are indicated by vertical lines
a period of T 90 fs (ω = 0.07 rad/fs). In addition, the spectra show a periodic
angular shift which repeats every T 260 fs (ω = 0.024 rad/fs), best observable
around θ = 180
◦ . For τ = 90 fs, we obtain an almost pure g-type angular distribution
characterized by two main and three side lobes (first white arrow in Fig. 3.12b). For
τ = 260 fs, the angular distribution is altered significantly. The central side lobe has
vanished due to destructive interference between the different photoelectron wave
packets. The remaining two side lobes are slightly shifted towards the equator at
θ = 180
◦ .
In the following, we perform an angular-selective analysis to separate the highly
entangled Rydberg wave packet dynamics from the Rydberg np- and n f -series. This
analysis allows us to uncover the origin of the observed Rydberg modes and, in
addition, to assign the observed Rydberg modes to inter- and intra-series beatings
between pairs of Rydberg f - and p-states. For this purpose, we extract horizontal
sections along the τ -axis from Fig. 3.12b at different polar angles θ , which correspond
to the zero-crossings of the d- and g-type wave packets (cf. Fig. 3.12c, d), respectively.
This permits us to disentangle the d- and g-type wave packet dynamics up to a
background signal originating from s-type wave packets. In Fig. 3.12b, the τ -resolved
section extracted at the zero-crossing of the g-type wave packet (g-zero) at θ =
160.1
◦ (green rectangles) and of the d-type wave packet (d-zero) at θ = 144.7
◦
(blue circles) are displayed. The respective Fourier spectra are plotted in Fig. 3.12d.
Both spectra exhibit a mode labeled by (1) which corresponds to the predominant
T 90 fs oscillation mentioned above. Hence, this mode is associated with both