

8 Towards Laser Intensity Calibration Using High-Field Ionization
157
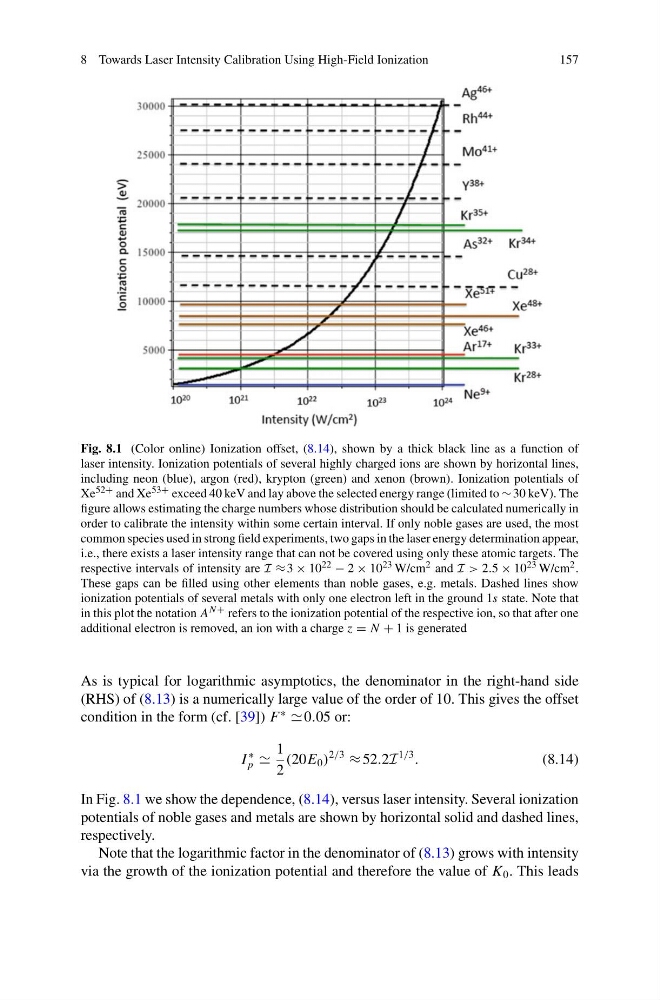
Fig. 8.1 (Color online) Ionization offset, (8.14), shown by a thick black line as a function of
laser intensity. Ionization potentials of several highly charged ions are shown by horizontal lines,
including neon (blue), argon (red), krypton (green) and xenon (brown). Ionization potentials of
Xe 52+ and Xe 53+ exceed 40 keV and lay above the selected energy range (limited to ∼ 30 keV). The
figure allows estimating the charge numbers whose distribution should be calculated numerically in
order to calibrate the intensity within some certain interval. If only noble gases are used, the most
common species used in strong field experiments, two gaps in the laser energy determination appear,
i.e., there exists a laser intensity range that can not be covered using only these atomic targets. The
respective intervals of intensity are I ≈ 3 × 10 22 − 2 × 10 23 W/cm 2 and I > 2.5 × 10 23 W/cm 2 .
These gaps can be filled using other elements than noble gases, e.g. metals. Dashed lines show
ionization potentials of several metals with only one electron left in the ground 1s state. Note that
in this plot the notation A N + refers to the ionization potential of the respective ion, so that after one
additional electron is removed, an ion with a charge z = N + 1 is generated
As is typical for logarithmic asymptotics, the denominator in the right-hand side
(RHS) of (8.13) is a numerically large value of the order of 10. This gives the offset
condition in the form (cf. [39]) F
∗
0.05 or:
I
∗
p
1
2
(20E 0 )
2/3
≈ 52.2I
1/3
.
(8.14)
In Fig. 8.1 we show the dependence, (8.14), versus laser intensity. Several ionization
potentials of noble gases and metals are shown by horizontal solid and dashed lines,
respectively.
Note that the logarithmic factor in the denominator of (8.13) grows with intensity
via the growth of the ionization potential and therefore the value of K 0 . This leads
157
Fig. 8.1 (Color online) Ionization offset, (8.14), shown by a thick black line as a function of
laser intensity. Ionization potentials of several highly charged ions are shown by horizontal lines,
including neon (blue), argon (red), krypton (green) and xenon (brown). Ionization potentials of
Xe 52+ and Xe 53+ exceed 40 keV and lay above the selected energy range (limited to ∼ 30 keV). The
figure allows estimating the charge numbers whose distribution should be calculated numerically in
order to calibrate the intensity within some certain interval. If only noble gases are used, the most
common species used in strong field experiments, two gaps in the laser energy determination appear,
i.e., there exists a laser intensity range that can not be covered using only these atomic targets. The
respective intervals of intensity are I ≈ 3 × 10 22 − 2 × 10 23 W/cm 2 and I > 2.5 × 10 23 W/cm 2 .
These gaps can be filled using other elements than noble gases, e.g. metals. Dashed lines show
ionization potentials of several metals with only one electron left in the ground 1s state. Note that
in this plot the notation A N + refers to the ionization potential of the respective ion, so that after one
additional electron is removed, an ion with a charge z = N + 1 is generated
As is typical for logarithmic asymptotics, the denominator in the right-hand side
(RHS) of (8.13) is a numerically large value of the order of 10. This gives the offset
condition in the form (cf. [39]) F
∗
0.05 or:
I
∗
p
1
2
(20E 0 )
2/3
≈ 52.2I
1/3
.
(8.14)
In Fig. 8.1 we show the dependence, (8.14), versus laser intensity. Several ionization
potentials of noble gases and metals are shown by horizontal solid and dashed lines,
respectively.
Note that the logarithmic factor in the denominator of (8.13) grows with intensity
via the growth of the ionization potential and therefore the value of K 0 . This leads