

4 Light-Dressed Spectroscopy of Molecules
89
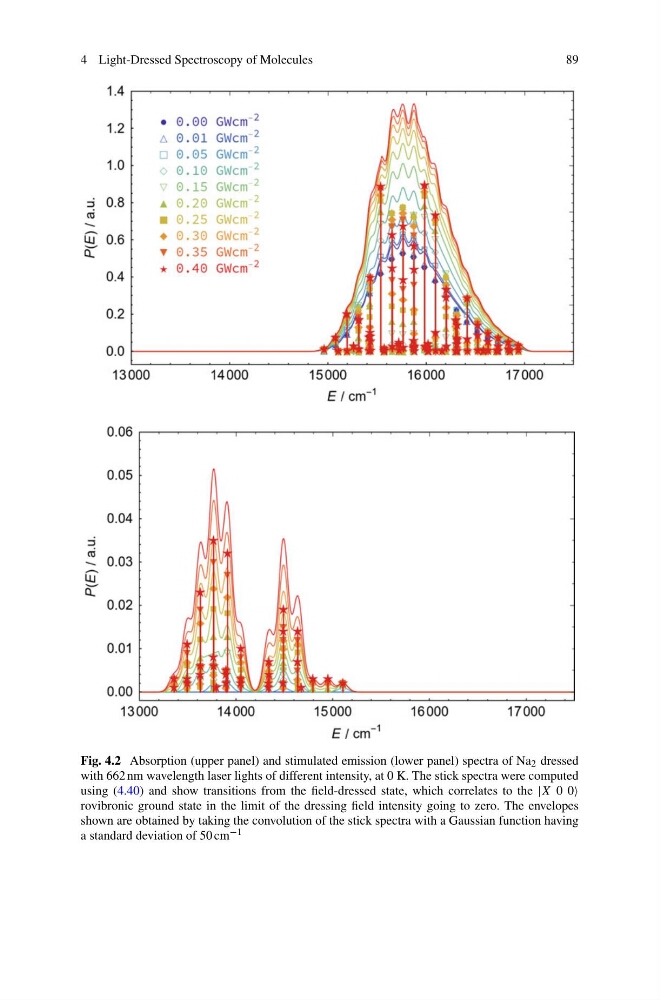
Fig. 4.2 Absorption (upper panel) and stimulated emission (lower panel) spectra of Na 2 dressed
with 662 nm wavelength laser lights of different intensity, at 0 K. The stick spectra were computed
using (4.40) and show transitions from the field-dressed state, which correlates to the |X 0 0
rovibronic ground state in the limit of the dressing field intensity going to zero. The envelopes
shown are obtained by taking the convolution of the stick spectra with a Gaussian function having
a standard deviation of 50 cm −1
89
Fig. 4.2 Absorption (upper panel) and stimulated emission (lower panel) spectra of Na 2 dressed
with 662 nm wavelength laser lights of different intensity, at 0 K. The stick spectra were computed
using (4.40) and show transitions from the field-dressed state, which correlates to the |X 0 0
rovibronic ground state in the limit of the dressing field intensity going to zero. The envelopes
shown are obtained by taking the convolution of the stick spectra with a Gaussian function having
a standard deviation of 50 cm −1