

2 Industrial Plant Oil Extraction
69
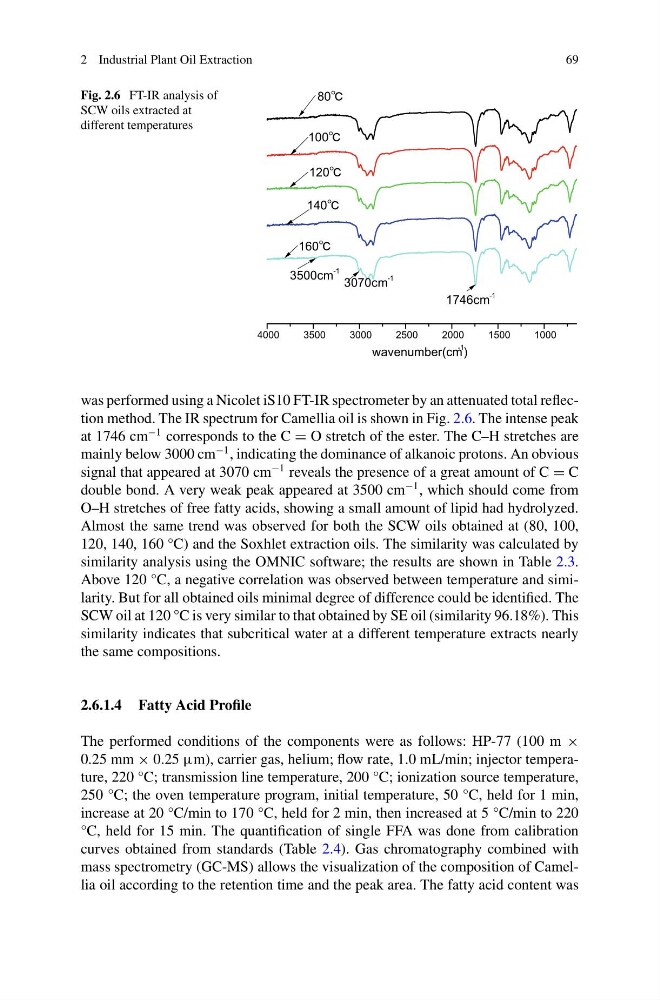
Fig. 2.6 FT-IR analysis of
SCW oils extracted at
different temperatures
4000
3500
3000
2500
2000
1500
1000
wavenumber(cm
-1
)
160
140
120
100
80
1746cm
-1
3500cm
-1
3070cm
-1
was performed using a Nicolet iS10 FT-IR spectrometer by an attenuated total reflection method. The IR spectrum for Camellia oil is shown in Fig. 2.6. The intense peak
at 1746 cm
−1 corresponds to the C = O stretch of the ester. The C–H stretches are
mainly below 3000 cm
−1 , indicating the dominance of alkanoic protons. An obvious
signal that appeared at 3070 cm
−1 reveals the presence of a great amount of C = C
double bond. A very weak peak appeared at 3500 cm
−1 , which should come from
O–H stretches of free fatty acids, showing a small amount of lipid had hydrolyzed.
Almost the same trend was observed for both the SCW oils obtained at (80, 100,
120, 140, 160 °C) and the Soxhlet extraction oils. The similarity was calculated by
similarity analysis using the OMNIC software; the results are shown in Table 2.3.
Above 120 °C, a negative correlation was observed between temperature and similarity. But for all obtained oils minimal degree of difference could be identified. The
SCW oil at 120 °C is very similar to that obtained by SE oil (similarity 96.18%). This
similarity indicates that subcritical water at a different temperature extracts nearly
the same compositions.
2.6.1.4 Fatty Acid Profile
The performed conditions of the components were as follows: HP-77 (100 m ×
0.25 mm × 0.25 μm), carrier gas, helium; flow rate, 1.0 mL/min; injector temperature, 220 °C; transmission line temperature, 200 °C; ionization source temperature,
250 °C; the oven temperature program, initial temperature, 50 °C, held for 1 min,
increase at 20 °C/min to 170 °C, held for 2 min, then increased at 5 °C/min to 220
°C, held for 15 min. The quantification of single FFA was done from calibration
curves obtained from standards (Table 2.4). Gas chromatography combined with
mass spectrometry (GC-MS) allows the visualization of the composition of Camellia oil according to the retention time and the peak area. The fatty acid content was
69
Fig. 2.6 FT-IR analysis of
SCW oils extracted at
different temperatures
4000
3500
3000
2500
2000
1500
1000
wavenumber(cm
-1
)
160
140
120
100
80
1746cm
-1
3500cm
-1
3070cm
-1
was performed using a Nicolet iS10 FT-IR spectrometer by an attenuated total reflection method. The IR spectrum for Camellia oil is shown in Fig. 2.6. The intense peak
at 1746 cm
−1 corresponds to the C = O stretch of the ester. The C–H stretches are
mainly below 3000 cm
−1 , indicating the dominance of alkanoic protons. An obvious
signal that appeared at 3070 cm
−1 reveals the presence of a great amount of C = C
double bond. A very weak peak appeared at 3500 cm
−1 , which should come from
O–H stretches of free fatty acids, showing a small amount of lipid had hydrolyzed.
Almost the same trend was observed for both the SCW oils obtained at (80, 100,
120, 140, 160 °C) and the Soxhlet extraction oils. The similarity was calculated by
similarity analysis using the OMNIC software; the results are shown in Table 2.3.
Above 120 °C, a negative correlation was observed between temperature and similarity. But for all obtained oils minimal degree of difference could be identified. The
SCW oil at 120 °C is very similar to that obtained by SE oil (similarity 96.18%). This
similarity indicates that subcritical water at a different temperature extracts nearly
the same compositions.
2.6.1.4 Fatty Acid Profile
The performed conditions of the components were as follows: HP-77 (100 m ×
0.25 mm × 0.25 μm), carrier gas, helium; flow rate, 1.0 mL/min; injector temperature, 220 °C; transmission line temperature, 200 °C; ionization source temperature,
250 °C; the oven temperature program, initial temperature, 50 °C, held for 1 min,
increase at 20 °C/min to 170 °C, held for 2 min, then increased at 5 °C/min to 220
°C, held for 15 min. The quantification of single FFA was done from calibration
curves obtained from standards (Table 2.4). Gas chromatography combined with
mass spectrometry (GC-MS) allows the visualization of the composition of Camellia oil according to the retention time and the peak area. The fatty acid content was