

564
6 Reverse Engineering of Microcircuits
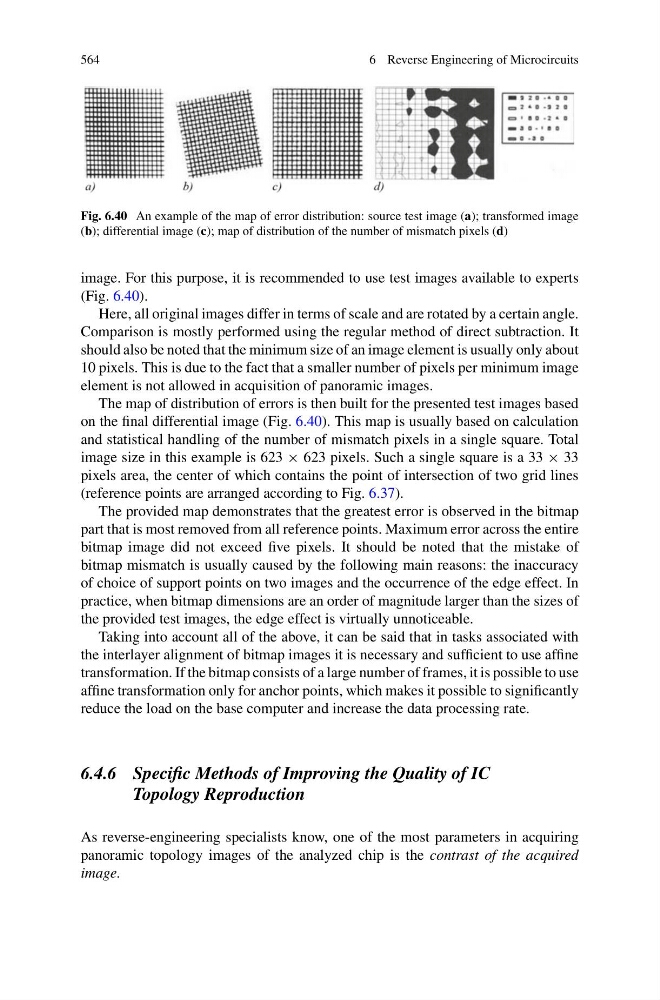
Fig. 6.40 An example of the map of error distribution: source test image (a); transformed image
(b); differential image (c); map of distribution of the number of mismatch pixels (d)
image. For this purpose, it is recommended to use test images available to experts
(Fig. 6.40).
Here, all original images differ in terms of scale and are rotated by a certain angle.
Comparison is mostly performed using the regular method of direct subtraction. It
should also be noted that the minimum size of an image element is usually only about
10 pixels. This is due to the fact that a smaller number of pixels per minimum image
element is not allowed in acquisition of panoramic images.
The map of distribution of errors is then built for the presented test images based
on the final differential image (Fig. 6.40). This map is usually based on calculation
and statistical handling of the number of mismatch pixels in a single square. Total
image size in this example is 623 × 623 pixels. Such a single square is a 33 × 33
pixels area, the center of which contains the point of intersection of two grid lines
(reference points are arranged according to Fig. 6.37).
The provided map demonstrates that the greatest error is observed in the bitmap
part that is most removed from all reference points. Maximum error across the entire
bitmap image did not exceed five pixels. It should be noted that the mistake of
bitmap mismatch is usually caused by the following main reasons: the inaccuracy
of choice of support points on two images and the occurrence of the edge effect. In
practice, when bitmap dimensions are an order of magnitude larger than the sizes of
the provided test images, the edge effect is virtually unnoticeable.
Taking into account all of the above, it can be said that in tasks associated with
the interlayer alignment of bitmap images it is necessary and sufficient to use affine
transformation. If the bitmap consists of a large number of frames, it is possible to use
affine transformation only for anchor points, which makes it possible to significantly
reduce the load on the base computer and increase the data processing rate.
6.4.6 Specific Methods of Improving the Quality of IC
Topology Reproduction
As reverse-engineering specialists know, one of the most parameters in acquiring
panoramic topology images of the analyzed chip is the contrast of the acquired
image.
6 Reverse Engineering of Microcircuits
Fig. 6.40 An example of the map of error distribution: source test image (a); transformed image
(b); differential image (c); map of distribution of the number of mismatch pixels (d)
image. For this purpose, it is recommended to use test images available to experts
(Fig. 6.40).
Here, all original images differ in terms of scale and are rotated by a certain angle.
Comparison is mostly performed using the regular method of direct subtraction. It
should also be noted that the minimum size of an image element is usually only about
10 pixels. This is due to the fact that a smaller number of pixels per minimum image
element is not allowed in acquisition of panoramic images.
The map of distribution of errors is then built for the presented test images based
on the final differential image (Fig. 6.40). This map is usually based on calculation
and statistical handling of the number of mismatch pixels in a single square. Total
image size in this example is 623 × 623 pixels. Such a single square is a 33 × 33
pixels area, the center of which contains the point of intersection of two grid lines
(reference points are arranged according to Fig. 6.37).
The provided map demonstrates that the greatest error is observed in the bitmap
part that is most removed from all reference points. Maximum error across the entire
bitmap image did not exceed five pixels. It should be noted that the mistake of
bitmap mismatch is usually caused by the following main reasons: the inaccuracy
of choice of support points on two images and the occurrence of the edge effect. In
practice, when bitmap dimensions are an order of magnitude larger than the sizes of
the provided test images, the edge effect is virtually unnoticeable.
Taking into account all of the above, it can be said that in tasks associated with
the interlayer alignment of bitmap images it is necessary and sufficient to use affine
transformation. If the bitmap consists of a large number of frames, it is possible to use
affine transformation only for anchor points, which makes it possible to significantly
reduce the load on the base computer and increase the data processing rate.
6.4.6 Specific Methods of Improving the Quality of IC
Topology Reproduction
As reverse-engineering specialists know, one of the most parameters in acquiring
panoramic topology images of the analyzed chip is the contrast of the acquired
image.