

492
5 Methods of Detecting Hardware Trojans in Microcircuits
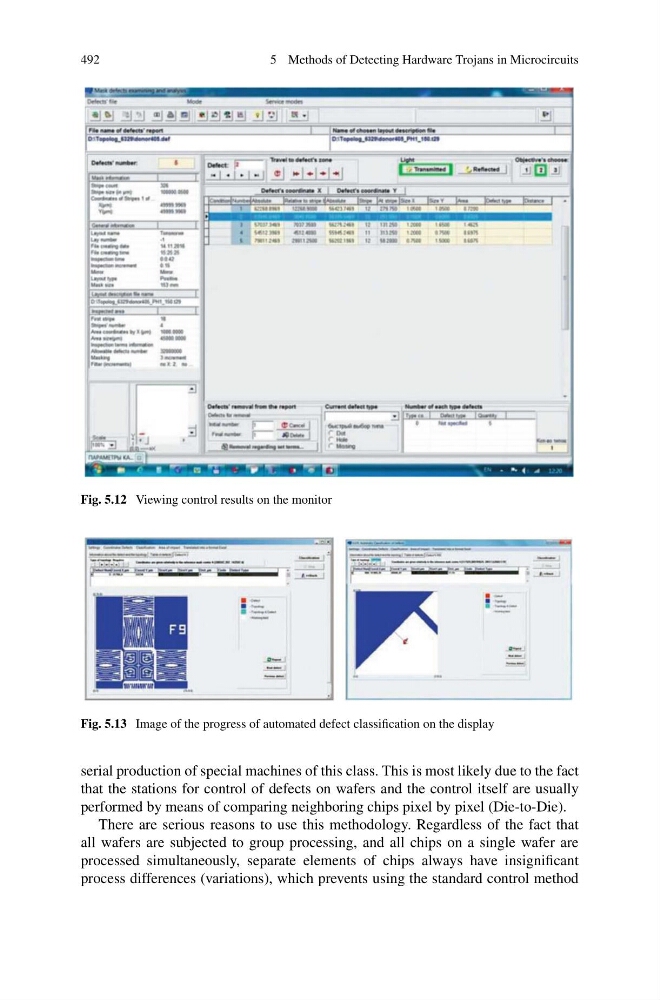
Fig. 5.12 Viewing control results on the monitor
Fig. 5.13 Image of the progress of automated defect classification on the display
serial production of special machines of this class. This is most likely due to the fact
that the stations for control of defects on wafers and the control itself are usually
performed by means of comparing neighboring chips pixel by pixel (Die-to-Die).
There are serious reasons to use this methodology. Regardless of the fact that
all wafers are subjected to group processing, and all chips on a single wafer are
processed simultaneously, separate elements of chips always have insignificant
process differences (variations), which prevents using the standard control method
5 Methods of Detecting Hardware Trojans in Microcircuits
Fig. 5.12 Viewing control results on the monitor
Fig. 5.13 Image of the progress of automated defect classification on the display
serial production of special machines of this class. This is most likely due to the fact
that the stations for control of defects on wafers and the control itself are usually
performed by means of comparing neighboring chips pixel by pixel (Die-to-Die).
There are serious reasons to use this methodology. Regardless of the fact that
all wafers are subjected to group processing, and all chips on a single wafer are
processed simultaneously, separate elements of chips always have insignificant
process differences (variations), which prevents using the standard control method