

5.2 Methods of Detecting Hardware Trojans in Microcircuits Based …
477
remaining charts. The bitmap image for HT (c) shows a hot area in the upper right
region, while the position of the warm region in charts for AT (d), AT (e), AT (f) is
clearly seen in the bottom region.
Based on the analysis performed, it can be expected that the horizontally extended
hotspot in the middle part of the bitmap image for HT (a) and HT (b) is caused by
horizontal tracing of the signal. Detailed examination of Fig. 7.4 shows that only
AT()a AT (b) have signals with horizontal tracing in the upper half of the FPGA.
Moreover, we suppose that warm round regions in all six charts are due to the circuit
of our hardware Trojan.
C. Golden reference microcircuit compared to smaller Trojans
In order to examine all expected possibilities of this method, including the possibility
to detect extremely small HTs, the authors of [1] repeated all the above experiments,
but used an extremely small 8-bit comparator as the Trojan trigger and did not use the
Trojan payload once again. In other words, they reduced the size of the Trojan circuit
to 0.1–1.3% of the entire area of the circuit. Tracing of the necessary signals from IOB
I/O blocks to the embedded block follows the same ways as shown in Fig. 5.2. For
this third round of experiments, the researchers once again created change protocols
for each of the six various microcircuits infected with HTs and compared them to
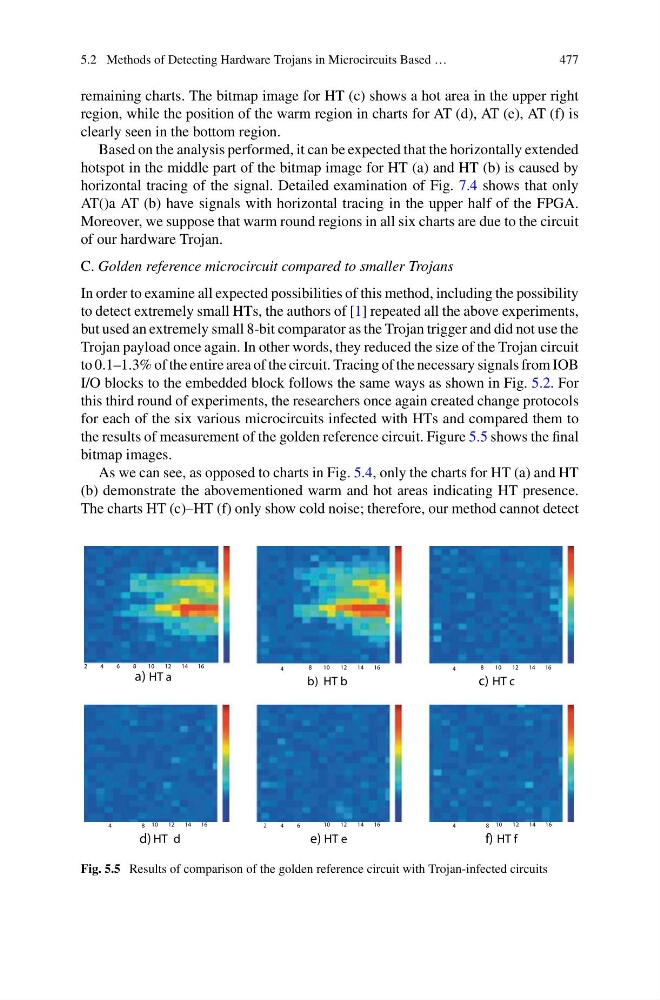
the results of measurement of the golden reference circuit. Figure 5.5 shows the final
bitmap images.
As we can see, as opposed to charts in Fig. 5.4, only the charts for HT (a) and HT
(b) demonstrate the abovementioned warm and hot areas indicating HT presence.
The charts HT (c)–HT (f) only show cold noise; therefore, our method cannot detect
2
4
6
8
10
12
14
16
a) HT a
8
1 0
1 2
1 4
1 6
b) HT b
4
8
10
12
14
16
c) HT c
4
10
12
14
16
4
8
10
12
14
16
d) HT d
e) HT e
f) HT f
2
4
6
10
12
14
16
4
8
Fig. 5.5 Results of comparison of the golden reference circuit with Trojan-infected circuits
477
remaining charts. The bitmap image for HT (c) shows a hot area in the upper right
region, while the position of the warm region in charts for AT (d), AT (e), AT (f) is
clearly seen in the bottom region.
Based on the analysis performed, it can be expected that the horizontally extended
hotspot in the middle part of the bitmap image for HT (a) and HT (b) is caused by
horizontal tracing of the signal. Detailed examination of Fig. 7.4 shows that only
AT()a AT (b) have signals with horizontal tracing in the upper half of the FPGA.
Moreover, we suppose that warm round regions in all six charts are due to the circuit
of our hardware Trojan.
C. Golden reference microcircuit compared to smaller Trojans
In order to examine all expected possibilities of this method, including the possibility
to detect extremely small HTs, the authors of [1] repeated all the above experiments,
but used an extremely small 8-bit comparator as the Trojan trigger and did not use the
Trojan payload once again. In other words, they reduced the size of the Trojan circuit
to 0.1–1.3% of the entire area of the circuit. Tracing of the necessary signals from IOB
I/O blocks to the embedded block follows the same ways as shown in Fig. 5.2. For
this third round of experiments, the researchers once again created change protocols
for each of the six various microcircuits infected with HTs and compared them to
the results of measurement of the golden reference circuit. Figure 5.5 shows the final
bitmap images.
As we can see, as opposed to charts in Fig. 5.4, only the charts for HT (a) and HT
(b) demonstrate the abovementioned warm and hot areas indicating HT presence.
The charts HT (c)–HT (f) only show cold noise; therefore, our method cannot detect
2
4
6
8
10
12
14
16
a) HT a
8
1 0
1 2
1 4
1 6
b) HT b
4
8
10
12
14
16
c) HT c
4
10
12
14
16
4
8
10
12
14
16
d) HT d
e) HT e
f) HT f
2
4
6
10
12
14
16
4
8
Fig. 5.5 Results of comparison of the golden reference circuit with Trojan-infected circuits