

5.2 Methods of Detecting Hardware Trojans in Microcircuits Based …
471
Degrees of variance v can be selected using the Welch—Satterthwaite equation
known to experts. It is also possible to use t and v together with the obtained tdistribution of measurement data to test the original assumption and ultimately calculate the p-value that may or may not provide reasons to reject the original hypothesis, according to which the average values are equal. However, the authors of the
method suggest working directly with t-multitudes instead of calculating p-values.
The first experiments demonstrated that this is fairly enough, since the researcher
shall carefully analyze the results and set measurement thresholds in any case.
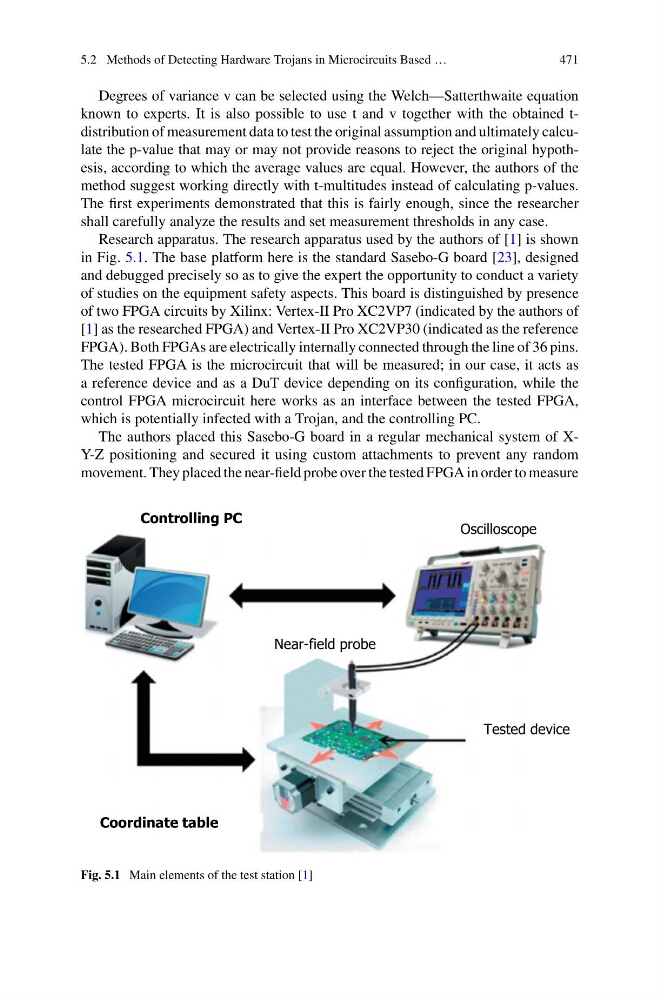
Research apparatus. The research apparatus used by the authors of [1] is shown
in Fig. 5.1. The base platform here is the standard Sasebo-G board [23], designed
and debugged precisely so as to give the expert the opportunity to conduct a variety
of studies on the equipment safety aspects. This board is distinguished by presence
of two FPGA circuits by Xilinx: Vertex-II Pro XC2VP7 (indicated by the authors of
[1] as the researched FPGA) and Vertex-II Pro XC2VP30 (indicated as the reference
FPGA). Both FPGAs are electrically internally connected through the line of 36 pins.
The tested FPGA is the microcircuit that will be measured; in our case, it acts as
a reference device and as a DuT device depending on its configuration, while the
control FPGA microcircuit here works as an interface between the tested FPGA,
which is potentially infected with a Trojan, and the controlling PC.
The authors placed this Sasebo-G board in a regular mechanical system of XY-Z positioning and secured it using custom attachments to prevent any random
movement. They placed the near-field probe over the tested FPGA in order to measure
Oscilloscope
Near-field probe
Tested device
Controlling PC
Coordinate table
Fig. 5.1 Main elements of the test station [1]
471
Degrees of variance v can be selected using the Welch—Satterthwaite equation
known to experts. It is also possible to use t and v together with the obtained tdistribution of measurement data to test the original assumption and ultimately calculate the p-value that may or may not provide reasons to reject the original hypothesis, according to which the average values are equal. However, the authors of the
method suggest working directly with t-multitudes instead of calculating p-values.
The first experiments demonstrated that this is fairly enough, since the researcher
shall carefully analyze the results and set measurement thresholds in any case.
Research apparatus. The research apparatus used by the authors of [1] is shown
in Fig. 5.1. The base platform here is the standard Sasebo-G board [23], designed
and debugged precisely so as to give the expert the opportunity to conduct a variety
of studies on the equipment safety aspects. This board is distinguished by presence
of two FPGA circuits by Xilinx: Vertex-II Pro XC2VP7 (indicated by the authors of
[1] as the researched FPGA) and Vertex-II Pro XC2VP30 (indicated as the reference
FPGA). Both FPGAs are electrically internally connected through the line of 36 pins.
The tested FPGA is the microcircuit that will be measured; in our case, it acts as
a reference device and as a DuT device depending on its configuration, while the
control FPGA microcircuit here works as an interface between the tested FPGA,
which is potentially infected with a Trojan, and the controlling PC.
The authors placed this Sasebo-G board in a regular mechanical system of XY-Z positioning and secured it using custom attachments to prevent any random
movement. They placed the near-field probe over the tested FPGA in order to measure
Oscilloscope
Near-field probe
Tested device
Controlling PC
Coordinate table
Fig. 5.1 Main elements of the test station [1]