

470
5 Methods of Detecting Hardware Trojans in Microcircuits
• Study phase, during which the researcher collects a sufficient quantity of EM
signal measurement data from the golden reference device in order to obtain characteristics for certain specific attributes of its distribution (in order to formulate
reference specific features);
• Selection phase, during which the results of EM measurements of microcircuits
are collected, and the statistical test is used to determine that the collected data have
been received from the same distribution as the reference characteristic attributes
(DuT does not contain a Trojan) or otherwise (DuT is infected).
The effectiveness of this methodology largely depends on two parameters. The
first is the magnitude (level) of leakage signals of the side channels, which can be
read either from the reference device or from DuT; this is needed to estimate the
measurement quality. The second is the selection of the most appropriate statistical
test, which is both error-resistant and reliable and allows for a fairly quick numerical
estimation. In addition, it is preferable for the test to be able to provide quantitative
assessment of the authenticity, which we ultimately obtain.
This method uses a balanced approach, which shall result in a similar number
of measurements of the golden reference circuit and DuT. It is very important
for measurement conditions to be as close to each other as possible. Two options
are provided: either measure the reference device every time when DuT testing is
required or obtain measurements of the reference device once and try to select signal
measurement conditions for all others every time DuT is measured. Intuitively, the
first approach appears to ensure better results; however, the second approach appears
to be more practical. The second approach is complicated by selection of measurement condition. Therefore, an important component of this work is the complex
problem of selecting methods to ensure resistance of the method to measurement
errors (interference).
After collecting side-channel measurement data from DuT, according to this
method, it is necessary to apply a statistical test to compare measurement results
with golden reference data. The main idea of this method is that EM radiations of a
DuT without a HT shall have the characteristics similar to the reference, while the
radiation of a DuT with a hardware Trojan will be less similar.
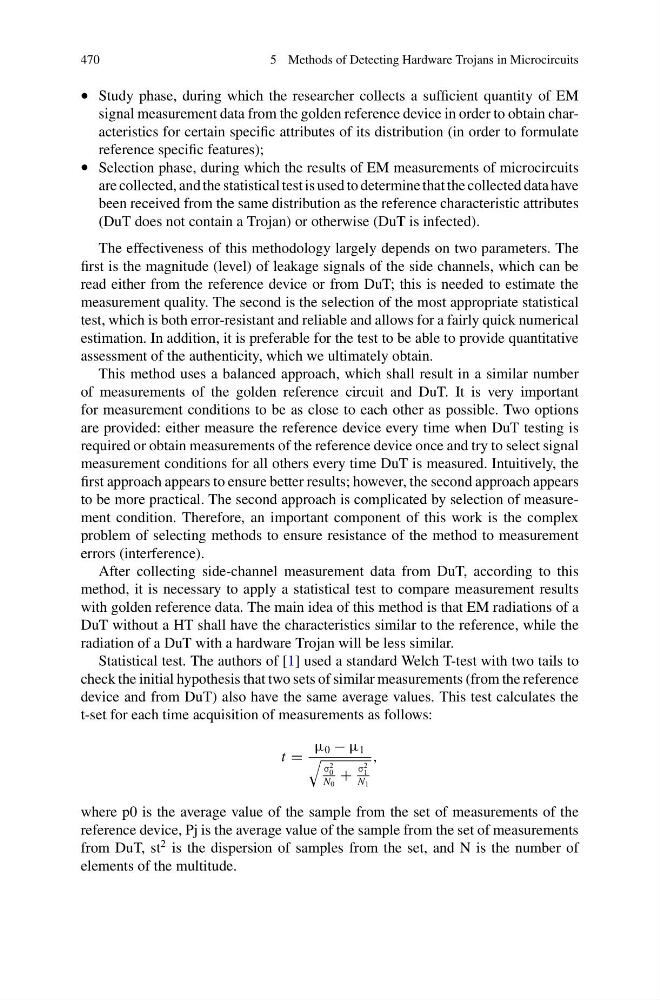
Statistical test. The authors of [1] used a standard Welch T-test with two tails to
check the initial hypothesis that two sets of similar measurements (from the reference
device and from DuT) also have the same average values. This test calculates the
t-set for each time acquisition of measurements as follows:
t =
μ 0 − μ 1
σ
2
0
N 0
+
σ
2
1
N 1
,
where p0 is the average value of the sample from the set of measurements of the
reference device, Pj is the average value of the sample from the set of measurements
from DuT, st
2 is the dispersion of samples from the set, and N is the number of
elements of the multitude.
5 Methods of Detecting Hardware Trojans in Microcircuits
• Study phase, during which the researcher collects a sufficient quantity of EM
signal measurement data from the golden reference device in order to obtain characteristics for certain specific attributes of its distribution (in order to formulate
reference specific features);
• Selection phase, during which the results of EM measurements of microcircuits
are collected, and the statistical test is used to determine that the collected data have
been received from the same distribution as the reference characteristic attributes
(DuT does not contain a Trojan) or otherwise (DuT is infected).
The effectiveness of this methodology largely depends on two parameters. The
first is the magnitude (level) of leakage signals of the side channels, which can be
read either from the reference device or from DuT; this is needed to estimate the
measurement quality. The second is the selection of the most appropriate statistical
test, which is both error-resistant and reliable and allows for a fairly quick numerical
estimation. In addition, it is preferable for the test to be able to provide quantitative
assessment of the authenticity, which we ultimately obtain.
This method uses a balanced approach, which shall result in a similar number
of measurements of the golden reference circuit and DuT. It is very important
for measurement conditions to be as close to each other as possible. Two options
are provided: either measure the reference device every time when DuT testing is
required or obtain measurements of the reference device once and try to select signal
measurement conditions for all others every time DuT is measured. Intuitively, the
first approach appears to ensure better results; however, the second approach appears
to be more practical. The second approach is complicated by selection of measurement condition. Therefore, an important component of this work is the complex
problem of selecting methods to ensure resistance of the method to measurement
errors (interference).
After collecting side-channel measurement data from DuT, according to this
method, it is necessary to apply a statistical test to compare measurement results
with golden reference data. The main idea of this method is that EM radiations of a
DuT without a HT shall have the characteristics similar to the reference, while the
radiation of a DuT with a hardware Trojan will be less similar.
Statistical test. The authors of [1] used a standard Welch T-test with two tails to
check the initial hypothesis that two sets of similar measurements (from the reference
device and from DuT) also have the same average values. This test calculates the
t-set for each time acquisition of measurements as follows:
t =
μ 0 − μ 1
σ
2
0
N 0
+
σ
2
1
N 1
,
where p0 is the average value of the sample from the set of measurements of the
reference device, Pj is the average value of the sample from the set of measurements
from DuT, st
2 is the dispersion of samples from the set, and N is the number of
elements of the multitude.