

132
G. Biswas and K. C. Sahu
)
b
(
)
a
(
10
100
Ga
0.1
1
10
100
Eo
I
II
III
IV
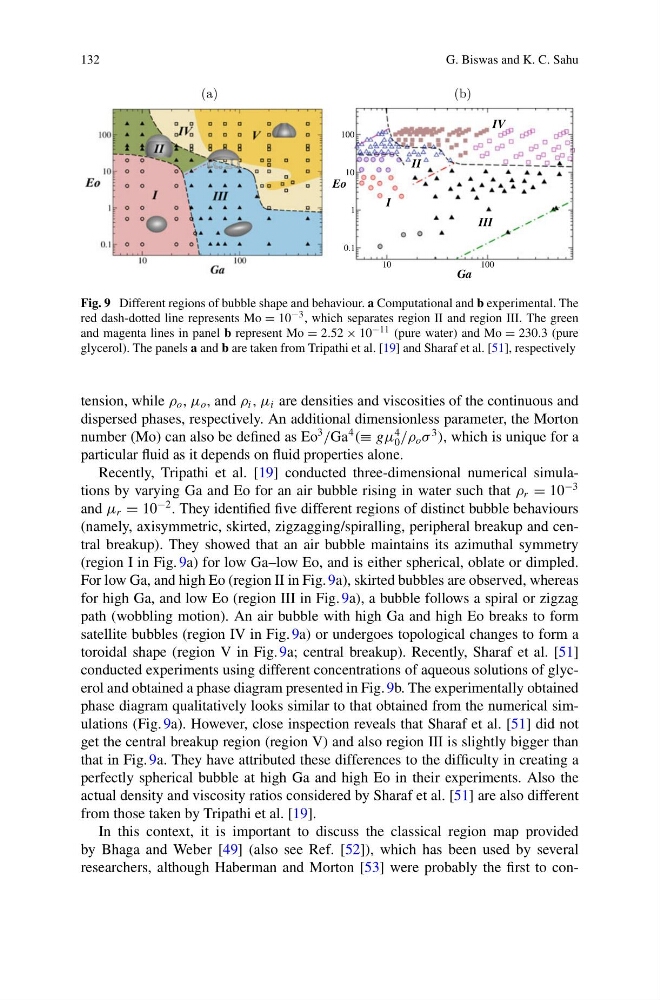
Fig. 9 Different regions of bubble shape and behaviour. a Computational and b experimental. The
red dash-dotted line represents Mo = 10 −3 , which separates region II and region III. The green
and magenta lines in panel b represent Mo = 2.52 × 10 −11 (pure water) and Mo = 230.3 (pure
glycerol). The panels a and b are taken from Tripathi et al. [19] and Sharaf et al. [51], respectively
tension, while ρ o , μ o , and ρ i , μ i are densities and viscosities of the continuous and
dispersed phases, respectively. An additional dimensionless parameter, the Morton
number (Mo) can also be defined as Eo
3
/Ga
4
(≡ gμ
4
0 /ρ o σ
3
), which is unique for a
particular fluid as it depends on fluid properties alone.
Recently, Tripathi et al. [19] conducted three-dimensional numerical simulations by varying Ga and Eo for an air bubble rising in water such that ρ r = 10
−3
and μ r = 10
−2 . They identified five different regions of distinct bubble behaviours
(namely, axisymmetric, skirted, zigzagging/spiralling, peripheral breakup and central breakup). They showed that an air bubble maintains its azimuthal symmetry
(region I in Fig. 9a) for low Ga–low Eo, and is either spherical, oblate or dimpled.
For low Ga, and high Eo (region II in Fig. 9a), skirted bubbles are observed, whereas
for high Ga, and low Eo (region III in Fig. 9a), a bubble follows a spiral or zigzag
path (wobbling motion). An air bubble with high Ga and high Eo breaks to form
satellite bubbles (region IV in Fig. 9a) or undergoes topological changes to form a
toroidal shape (region V in Fig. 9a; central breakup). Recently, Sharaf et al. [51]
conducted experiments using different concentrations of aqueous solutions of glycerol and obtained a phase diagram presented in Fig. 9b. The experimentally obtained
phase diagram qualitatively looks similar to that obtained from the numerical simulations (Fig. 9a). However, close inspection reveals that Sharaf et al. [51] did not
get the central breakup region (region V) and also region III is slightly bigger than
that in Fig. 9a. They have attributed these differences to the difficulty in creating a
perfectly spherical bubble at high Ga and high Eo in their experiments. Also the
actual density and viscosity ratios considered by Sharaf et al. [51] are also different
from those taken by Tripathi et al. [19].
In this context, it is important to discuss the classical region map provided
by Bhaga and Weber [49] (also see Ref. [52]), which has been used by several
researchers, although Haberman and Morton [53] were probably the first to con-
G. Biswas and K. C. Sahu
)
b
(
)
a
(
10
100
Ga
0.1
1
10
100
Eo
I
II
III
IV
Fig. 9 Different regions of bubble shape and behaviour. a Computational and b experimental. The
red dash-dotted line represents Mo = 10 −3 , which separates region II and region III. The green
and magenta lines in panel b represent Mo = 2.52 × 10 −11 (pure water) and Mo = 230.3 (pure
glycerol). The panels a and b are taken from Tripathi et al. [19] and Sharaf et al. [51], respectively
tension, while ρ o , μ o , and ρ i , μ i are densities and viscosities of the continuous and
dispersed phases, respectively. An additional dimensionless parameter, the Morton
number (Mo) can also be defined as Eo
3
/Ga
4
(≡ gμ
4
0 /ρ o σ
3
), which is unique for a
particular fluid as it depends on fluid properties alone.
Recently, Tripathi et al. [19] conducted three-dimensional numerical simulations by varying Ga and Eo for an air bubble rising in water such that ρ r = 10
−3
and μ r = 10
−2 . They identified five different regions of distinct bubble behaviours
(namely, axisymmetric, skirted, zigzagging/spiralling, peripheral breakup and central breakup). They showed that an air bubble maintains its azimuthal symmetry
(region I in Fig. 9a) for low Ga–low Eo, and is either spherical, oblate or dimpled.
For low Ga, and high Eo (region II in Fig. 9a), skirted bubbles are observed, whereas
for high Ga, and low Eo (region III in Fig. 9a), a bubble follows a spiral or zigzag
path (wobbling motion). An air bubble with high Ga and high Eo breaks to form
satellite bubbles (region IV in Fig. 9a) or undergoes topological changes to form a
toroidal shape (region V in Fig. 9a; central breakup). Recently, Sharaf et al. [51]
conducted experiments using different concentrations of aqueous solutions of glycerol and obtained a phase diagram presented in Fig. 9b. The experimentally obtained
phase diagram qualitatively looks similar to that obtained from the numerical simulations (Fig. 9a). However, close inspection reveals that Sharaf et al. [51] did not
get the central breakup region (region V) and also region III is slightly bigger than
that in Fig. 9a. They have attributed these differences to the difficulty in creating a
perfectly spherical bubble at high Ga and high Eo in their experiments. Also the
actual density and viscosity ratios considered by Sharaf et al. [51] are also different
from those taken by Tripathi et al. [19].
In this context, it is important to discuss the classical region map provided
by Bhaga and Weber [49] (also see Ref. [52]), which has been used by several
researchers, although Haberman and Morton [53] were probably the first to con-