

13 Smart Learning Using Big and Small Data for Mobile and IOT e-Health
617
four–stage policy
Baseline mean
stress level
> 5.4
Be inactive for
1 week
Action for
the first
week
Action for
the second
week
Action for
the third
week
Action for
the fourth
week
Be active for
2 nd week
Be active for
3 rd week
Be inactive
for 3 rd week
Be active for 4 th
week
Be inactive for
4 th week
Be active for 4 th
week
Be inactive
for 3 rd week
Be active for
3 rd week
Be active for
2 nd week
Be inactive
for 2 nd week
Be inactive
for 2 nd week
Be active for
2 nd week
Be inactive
for 2 nd week
Be active for
1 week
> 5.4
< 2.5
< 2.5
2.5
2.5
Active during
1 st week
Active during
1 st week
Yes
Yes
< 2.5
No
Yes
> 1.9
No
Yes
2.5
>1.9
1.9
1.9
No
1 st week mean stress
decreased from bl by
1 st week mean stress
decreased from bl by
1 st week mean stress
decreased from bl by
Active during
2 nd week
2 nd week mean
stress increased
from 1 st week by
2 nd week mean
stress increased
from 1 st week by
Active during
3 rd week
No
5.4
5.4
Baseline mean
stress level
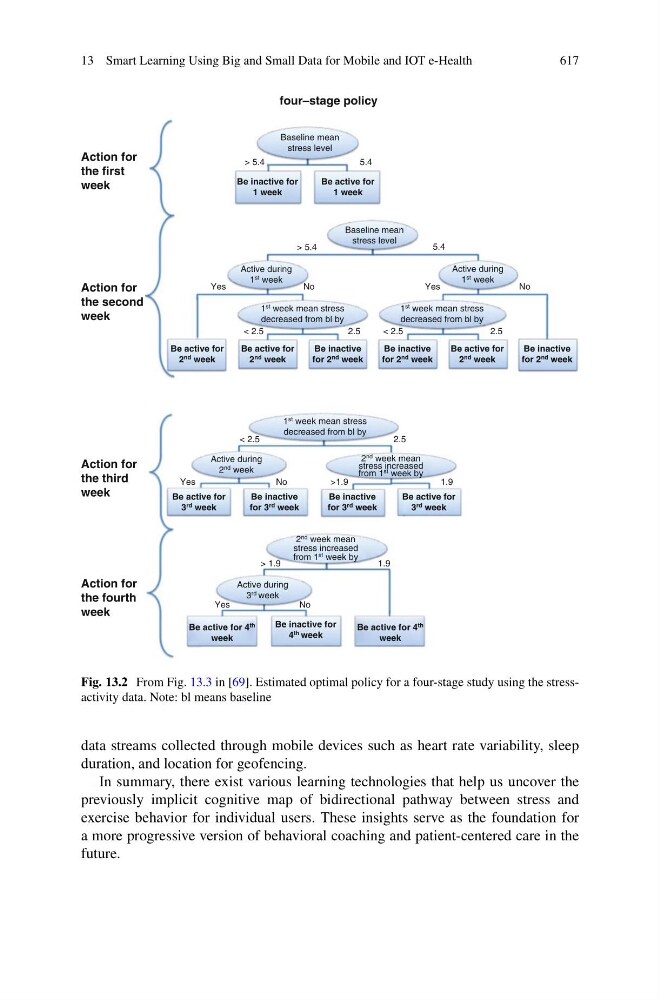
Fig. 13.2 From Fig. 13.3 in [69]. Estimated optimal policy for a four-stage study using the stressactivity data. Note: bl means baseline
data streams collected through mobile devices such as heart rate variability, sleep
duration, and location for geofencing.
In summary, there exist various learning technologies that help us uncover the
previously implicit cognitive map of bidirectional pathway between stress and
exercise behavior for individual users. These insights serve as the foundation for
a more progressive version of behavioral coaching and patient-centered care in the
future.
617
four–stage policy
Baseline mean
stress level
> 5.4
Be inactive for
1 week
Action for
the first
week
Action for
the second
week
Action for
the third
week
Action for
the fourth
week
Be active for
2 nd week
Be active for
3 rd week
Be inactive
for 3 rd week
Be active for 4 th
week
Be inactive for
4 th week
Be active for 4 th
week
Be inactive
for 3 rd week
Be active for
3 rd week
Be active for
2 nd week
Be inactive
for 2 nd week
Be inactive
for 2 nd week
Be active for
2 nd week
Be inactive
for 2 nd week
Be active for
1 week
> 5.4
< 2.5
< 2.5
2.5
2.5
Active during
1 st week
Active during
1 st week
Yes
Yes
< 2.5
No
Yes
> 1.9
No
Yes
2.5
>1.9
1.9
1.9
No
1 st week mean stress
decreased from bl by
1 st week mean stress
decreased from bl by
1 st week mean stress
decreased from bl by
Active during
2 nd week
2 nd week mean
stress increased
from 1 st week by
2 nd week mean
stress increased
from 1 st week by
Active during
3 rd week
No
5.4
5.4
Baseline mean
stress level
Fig. 13.2 From Fig. 13.3 in [69]. Estimated optimal policy for a four-stage study using the stressactivity data. Note: bl means baseline
data streams collected through mobile devices such as heart rate variability, sleep
duration, and location for geofencing.
In summary, there exist various learning technologies that help us uncover the
previously implicit cognitive map of bidirectional pathway between stress and
exercise behavior for individual users. These insights serve as the foundation for
a more progressive version of behavioral coaching and patient-centered care in the
future.