

12 Biomedical Engineering Fundamentals
573
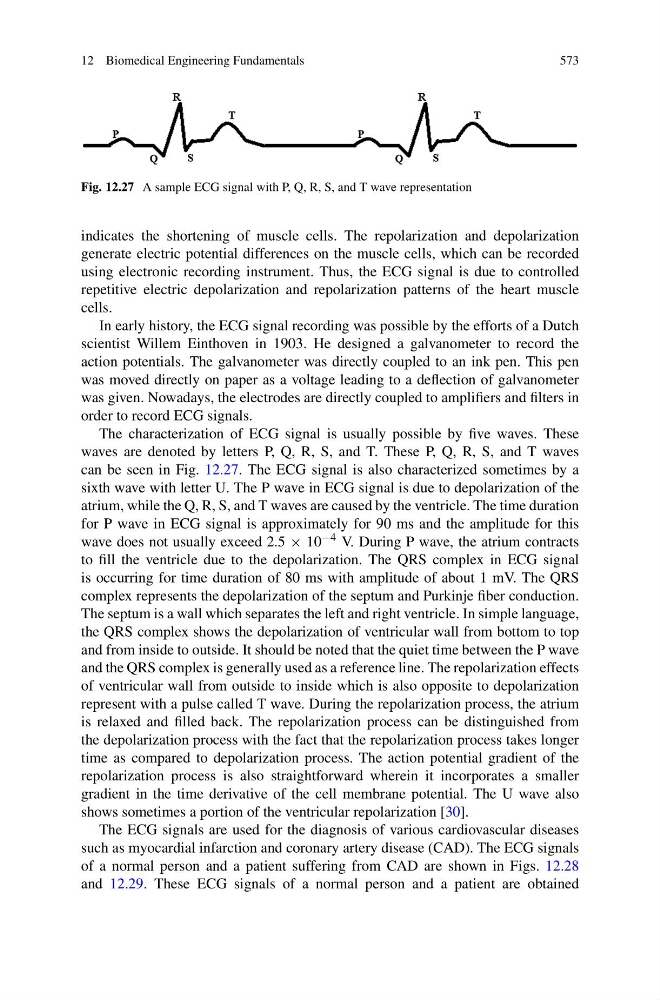
Fig. 12.27 A sample ECG signal with P, Q, R, S, and T wave representation
indicates the shortening of muscle cells. The repolarization and depolarization
generate electric potential differences on the muscle cells, which can be recorded
using electronic recording instrument. Thus, the ECG signal is due to controlled
repetitive electric depolarization and repolarization patterns of the heart muscle
cells.
In early history, the ECG signal recording was possible by the efforts of a Dutch
scientist Willem Einthoven in 1903. He designed a galvanometer to record the
action potentials. The galvanometer was directly coupled to an ink pen. This pen
was moved directly on paper as a voltage leading to a deflection of galvanometer
was given. Nowadays, the electrodes are directly coupled to amplifiers and filters in
order to record ECG signals.
The characterization of ECG signal is usually possible by five waves. These
waves are denoted by letters P, Q, R, S, and T. These P, Q, R, S, and T waves
can be seen in Fig. 12.27. The ECG signal is also characterized sometimes by a
sixth wave with letter U. The P wave in ECG signal is due to depolarization of the
atrium, while the Q, R, S, and T waves are caused by the ventricle. The time duration
for P wave in ECG signal is approximately for 90 ms and the amplitude for this
wave does not usually exceed 2.5 × 10 −4 V. During P wave, the atrium contracts
to fill the ventricle due to the depolarization. The QRS complex in ECG signal
is occurring for time duration of 80 ms with amplitude of about 1 mV. The QRS
complex represents the depolarization of the septum and Purkinje fiber conduction.
The septum is a wall which separates the left and right ventricle. In simple language,
the QRS complex shows the depolarization of ventricular wall from bottom to top
and from inside to outside. It should be noted that the quiet time between the P wave
and the QRS complex is generally used as a reference line. The repolarization effects
of ventricular wall from outside to inside which is also opposite to depolarization
represent with a pulse called T wave. During the repolarization process, the atrium
is relaxed and filled back. The repolarization process can be distinguished from
the depolarization process with the fact that the repolarization process takes longer
time as compared to depolarization process. The action potential gradient of the
repolarization process is also straightforward wherein it incorporates a smaller
gradient in the time derivative of the cell membrane potential. The U wave also
shows sometimes a portion of the ventricular repolarization [30].
The ECG signals are used for the diagnosis of various cardiovascular diseases
such as myocardial infarction and coronary artery disease (CAD). The ECG signals
of a normal person and a patient suffering from CAD are shown in Figs. 12.28
and 12.29. These ECG signals of a normal person and a patient are obtained
573
Fig. 12.27 A sample ECG signal with P, Q, R, S, and T wave representation
indicates the shortening of muscle cells. The repolarization and depolarization
generate electric potential differences on the muscle cells, which can be recorded
using electronic recording instrument. Thus, the ECG signal is due to controlled
repetitive electric depolarization and repolarization patterns of the heart muscle
cells.
In early history, the ECG signal recording was possible by the efforts of a Dutch
scientist Willem Einthoven in 1903. He designed a galvanometer to record the
action potentials. The galvanometer was directly coupled to an ink pen. This pen
was moved directly on paper as a voltage leading to a deflection of galvanometer
was given. Nowadays, the electrodes are directly coupled to amplifiers and filters in
order to record ECG signals.
The characterization of ECG signal is usually possible by five waves. These
waves are denoted by letters P, Q, R, S, and T. These P, Q, R, S, and T waves
can be seen in Fig. 12.27. The ECG signal is also characterized sometimes by a
sixth wave with letter U. The P wave in ECG signal is due to depolarization of the
atrium, while the Q, R, S, and T waves are caused by the ventricle. The time duration
for P wave in ECG signal is approximately for 90 ms and the amplitude for this
wave does not usually exceed 2.5 × 10 −4 V. During P wave, the atrium contracts
to fill the ventricle due to the depolarization. The QRS complex in ECG signal
is occurring for time duration of 80 ms with amplitude of about 1 mV. The QRS
complex represents the depolarization of the septum and Purkinje fiber conduction.
The septum is a wall which separates the left and right ventricle. In simple language,
the QRS complex shows the depolarization of ventricular wall from bottom to top
and from inside to outside. It should be noted that the quiet time between the P wave
and the QRS complex is generally used as a reference line. The repolarization effects
of ventricular wall from outside to inside which is also opposite to depolarization
represent with a pulse called T wave. During the repolarization process, the atrium
is relaxed and filled back. The repolarization process can be distinguished from
the depolarization process with the fact that the repolarization process takes longer
time as compared to depolarization process. The action potential gradient of the
repolarization process is also straightforward wherein it incorporates a smaller
gradient in the time derivative of the cell membrane potential. The U wave also
shows sometimes a portion of the ventricular repolarization [30].
The ECG signals are used for the diagnosis of various cardiovascular diseases
such as myocardial infarction and coronary artery disease (CAD). The ECG signals
of a normal person and a patient suffering from CAD are shown in Figs. 12.28
and 12.29. These ECG signals of a normal person and a patient are obtained