

280
F. Firouzi et al.
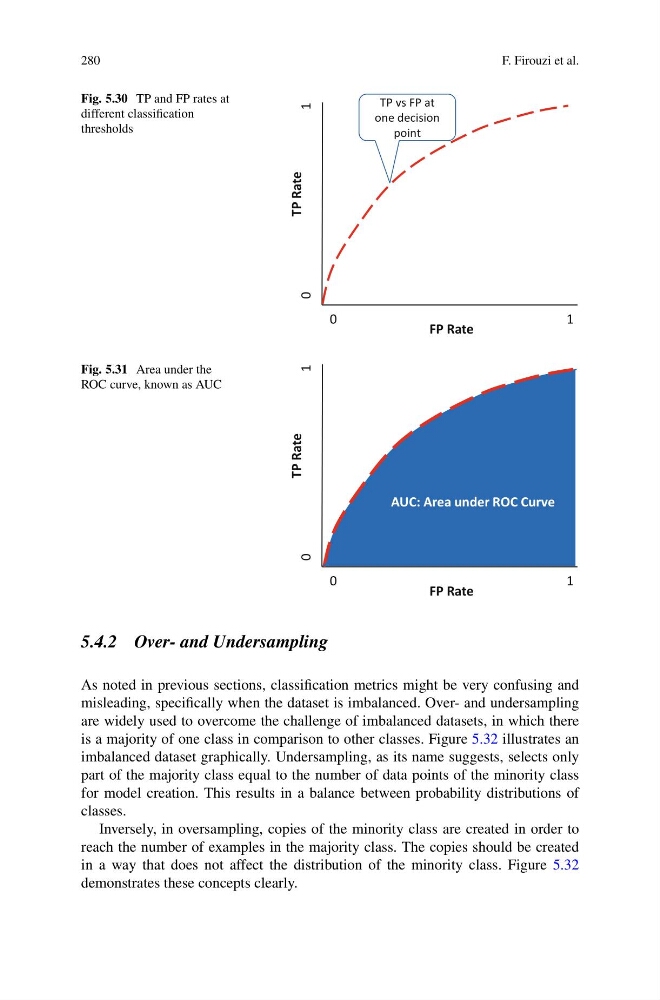
Fig. 5.30 TP and FP rates at
different classification
thresholds
FP Rate
1
0
1
0
e
t
a
R
P
T
TP vs FP at
one decision
point
Fig. 5.31 Area under the
ROC curve, known as AUC
FP Rate
1
0
1
0
TP Rate
AUC: Area under ROC Curve
5.4.2 Over- and Undersampling
As noted in previous sections, classification metrics might be very confusing and
misleading, specifically when the dataset is imbalanced. Over- and undersampling
are widely used to overcome the challenge of imbalanced datasets, in which there
is a majority of one class in comparison to other classes. Figure 5.32 illustrates an
imbalanced dataset graphically. Undersampling, as its name suggests, selects only
part of the majority class equal to the number of data points of the minority class
for model creation. This results in a balance between probability distributions of
classes.
Inversely, in oversampling, copies of the minority class are created in order to
reach the number of examples in the majority class. The copies should be created
in a way that does not affect the distribution of the minority class. Figure 5.32
demonstrates these concepts clearly.
F. Firouzi et al.
Fig. 5.30 TP and FP rates at
different classification
thresholds
FP Rate
1
0
1
0
e
t
a
R
P
T
TP vs FP at
one decision
point
Fig. 5.31 Area under the
ROC curve, known as AUC
FP Rate
1
0
1
0
TP Rate
AUC: Area under ROC Curve
5.4.2 Over- and Undersampling
As noted in previous sections, classification metrics might be very confusing and
misleading, specifically when the dataset is imbalanced. Over- and undersampling
are widely used to overcome the challenge of imbalanced datasets, in which there
is a majority of one class in comparison to other classes. Figure 5.32 illustrates an
imbalanced dataset graphically. Undersampling, as its name suggests, selects only
part of the majority class equal to the number of data points of the minority class
for model creation. This results in a balance between probability distributions of
classes.
Inversely, in oversampling, copies of the minority class are created in order to
reach the number of examples in the majority class. The copies should be created
in a way that does not affect the distribution of the minority class. Figure 5.32
demonstrates these concepts clearly.