

5 Machine Learning for IoT
279
Choosing the proper metric between precision and recall depends purely on the
problem statement and application. As a general rule, if the focus is on minimizing
the false negatives, effort should be put on making the recall value close to 100%.
On the other hand, if it is important to minimize false positives, the precision value
should be close to 100%.
Specificity (True Negative Rate)
Specificity or true negative rate, as suggested by its name, measures the ability of the
model to identify those cases that are negative correctly. In our example, specificity
would be the proportion of the predicted healthy (i.e., negative: do not have cancer)
people that are correctly marked as healthy. Therefore, the model will have 100%
specificity when it correctly finds all patients without cancer.
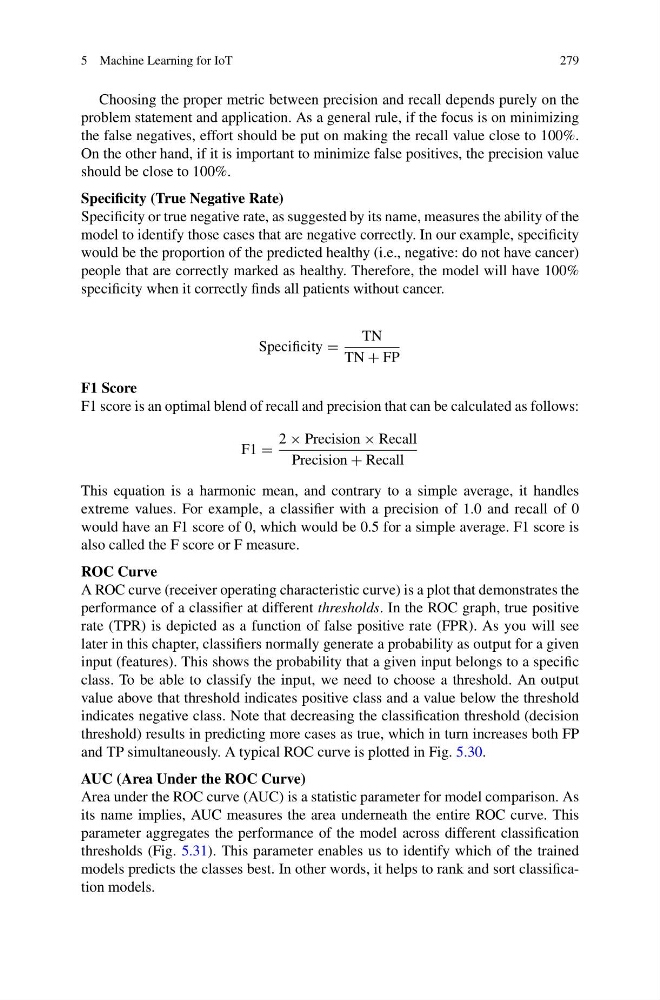
Specificity =
TN
TN + FP
F1 Score
F1 score is an optimal blend of recall and precision that can be calculated as follows:
F1 =
2 × Precision × Recall
Precision + Recall
This equation is a harmonic mean, and contrary to a simple average, it handles
extreme values. For example, a classifier with a precision of 1.0 and recall of 0
would have an F1 score of 0, which would be 0.5 for a simple average. F1 score is
also called the F score or F measure.
ROC Curve
A ROC curve (receiver operating characteristic curve) is a plot that demonstrates the
performance of a classifier at different thresholds. In the ROC graph, true positive
rate (TPR) is depicted as a function of false positive rate (FPR). As you will see
later in this chapter, classifiers normally generate a probability as output for a given
input (features). This shows the probability that a given input belongs to a specific
class. To be able to classify the input, we need to choose a threshold. An output
value above that threshold indicates positive class and a value below the threshold
indicates negative class. Note that decreasing the classification threshold (decision
threshold) results in predicting more cases as true, which in turn increases both FP
and TP simultaneously. A typical ROC curve is plotted in Fig. 5.30.
AUC (Area Under the ROC Curve)
Area under the ROC curve (AUC) is a statistic parameter for model comparison. As
its name implies, AUC measures the area underneath the entire ROC curve. This
parameter aggregates the performance of the model across different classification
thresholds (Fig. 5.31). This parameter enables us to identify which of the trained
models predicts the classes best. In other words, it helps to rank and sort classification models.
279
Choosing the proper metric between precision and recall depends purely on the
problem statement and application. As a general rule, if the focus is on minimizing
the false negatives, effort should be put on making the recall value close to 100%.
On the other hand, if it is important to minimize false positives, the precision value
should be close to 100%.
Specificity (True Negative Rate)
Specificity or true negative rate, as suggested by its name, measures the ability of the
model to identify those cases that are negative correctly. In our example, specificity
would be the proportion of the predicted healthy (i.e., negative: do not have cancer)
people that are correctly marked as healthy. Therefore, the model will have 100%
specificity when it correctly finds all patients without cancer.
Specificity =
TN
TN + FP
F1 Score
F1 score is an optimal blend of recall and precision that can be calculated as follows:
F1 =
2 × Precision × Recall
Precision + Recall
This equation is a harmonic mean, and contrary to a simple average, it handles
extreme values. For example, a classifier with a precision of 1.0 and recall of 0
would have an F1 score of 0, which would be 0.5 for a simple average. F1 score is
also called the F score or F measure.
ROC Curve
A ROC curve (receiver operating characteristic curve) is a plot that demonstrates the
performance of a classifier at different thresholds. In the ROC graph, true positive
rate (TPR) is depicted as a function of false positive rate (FPR). As you will see
later in this chapter, classifiers normally generate a probability as output for a given
input (features). This shows the probability that a given input belongs to a specific
class. To be able to classify the input, we need to choose a threshold. An output
value above that threshold indicates positive class and a value below the threshold
indicates negative class. Note that decreasing the classification threshold (decision
threshold) results in predicting more cases as true, which in turn increases both FP
and TP simultaneously. A typical ROC curve is plotted in Fig. 5.30.
AUC (Area Under the ROC Curve)
Area under the ROC curve (AUC) is a statistic parameter for model comparison. As
its name implies, AUC measures the area underneath the entire ROC curve. This
parameter aggregates the performance of the model across different classification
thresholds (Fig. 5.31). This parameter enables us to identify which of the trained
models predicts the classes best. In other words, it helps to rank and sort classification models.