

274
F. Firouzi et al.
5.3.1.2 Pearson Correlation
Pearson correlation methods filter the features based on their correlation coefficient,
so one can write it as follows:
ρ i =
cov (X i , Y )
σ (X i ) σ Y
where X i is the input (feature), Y is the output, (X i , Y) is the covariance, and
parameter σ is the standard deviation. The Pearson correlation coefficient, which
is also called a sample correlation coefficient or sample Pearson correlation
coefficient, has a value in the range of [−1,+1]. The 0 coefficient indicates that
there is no correlation between the two variables. A value greater than 0 implies that
there is a positive correlation (i.e., when a variable goes up, the other variable also
tends to increase) between variables, and a value less than 0 indicates a negative
correlation.
5.3.1.3 Entropy
Entropy is a robust tool for correlation estimation and feature selection. Entropy is a
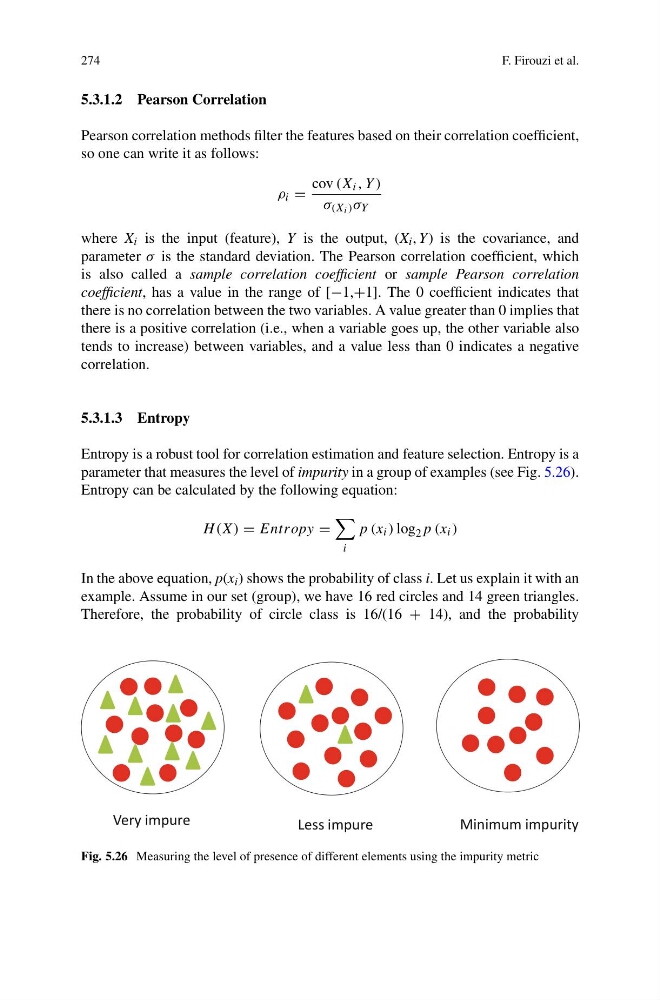
parameter that measures the level of impurity in a group of examples (see Fig. 5.26).
Entropy can be calculated by the following equation:
H (X) = Entropy =
i
p (x i ) log 2 p (x i )
In the above equation, p(x i ) shows the probability of class i. Let us explain it with an
example. Assume in our set (group), we have 16 red circles and 14 green triangles.
Therefore, the probability of circle class is 16/(16 + 14), and the probability
Very impure
Less impure
Minimum impurity
Fig. 5.26 Measuring the level of presence of different elements using the impurity metric
F. Firouzi et al.
5.3.1.2 Pearson Correlation
Pearson correlation methods filter the features based on their correlation coefficient,
so one can write it as follows:
ρ i =
cov (X i , Y )
σ (X i ) σ Y
where X i is the input (feature), Y is the output, (X i , Y) is the covariance, and
parameter σ is the standard deviation. The Pearson correlation coefficient, which
is also called a sample correlation coefficient or sample Pearson correlation
coefficient, has a value in the range of [−1,+1]. The 0 coefficient indicates that
there is no correlation between the two variables. A value greater than 0 implies that
there is a positive correlation (i.e., when a variable goes up, the other variable also
tends to increase) between variables, and a value less than 0 indicates a negative
correlation.
5.3.1.3 Entropy
Entropy is a robust tool for correlation estimation and feature selection. Entropy is a
parameter that measures the level of impurity in a group of examples (see Fig. 5.26).
Entropy can be calculated by the following equation:
H (X) = Entropy =
i
p (x i ) log 2 p (x i )
In the above equation, p(x i ) shows the probability of class i. Let us explain it with an
example. Assume in our set (group), we have 16 red circles and 14 green triangles.
Therefore, the probability of circle class is 16/(16 + 14), and the probability
Very impure
Less impure
Minimum impurity
Fig. 5.26 Measuring the level of presence of different elements using the impurity metric