

5 Machine Learning for IoT
249
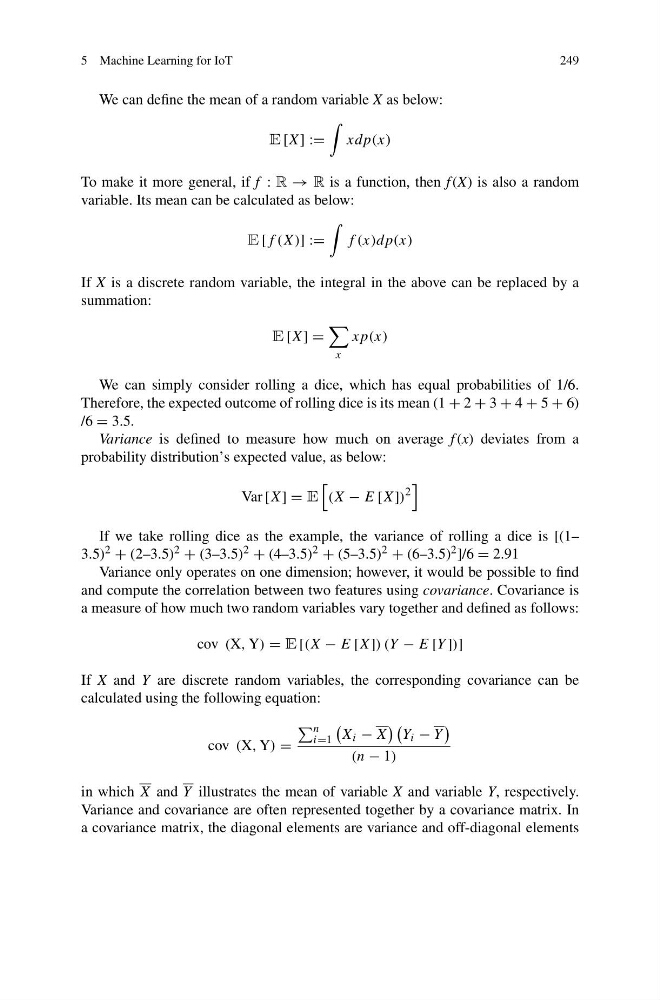
We can define the mean of a random variable X as below:
E [X] :=
xdp(x)
To make it more general, if f : R → R is a function, then f (X) is also a random
variable. Its mean can be calculated as below:
E [f (X)] :=
f (x)dp(x)
If X is a discrete random variable, the integral in the above can be replaced by a
summation:
E [X] =
x
xp(x)
We can simply consider rolling a dice, which has equal probabilities of 1/6.
Therefore, the expected outcome of rolling dice is its mean (1 + 2 + 3 + 4 + 5 + 6)
/6 = 3.5.
Variance is defined to measure how much on average f (x) deviates from a
probability distribution’s expected value, as below:
Var [X] = E
(X − E [X])
2
If we take rolling dice as the example, the variance of rolling a dice is [(1–
3.5) 2 + (2–3.5) 2 + (3–3.5) 2 + (4–3.5) 2 + (5–3.5) 2 + (6–3.5) 2 ]/6 = 2.91
Variance only operates on one dimension; however, it would be possible to find
and compute the correlation between two features using covariance. Covariance is
a measure of how much two random variables vary together and defined as follows:
cov (X, Y) = E [(X − E [X]) (Y − E [Y ])]
If X and Y are discrete random variables, the corresponding covariance can be
calculated using the following equation:
cov (X, Y) =
n
i=1
X i − X
Y i − Y
(n − 1)
in which X and Y illustrates the mean of variable X and variable Y, respectively.
Variance and covariance are often represented together by a covariance matrix. In
a covariance matrix, the diagonal elements are variance and off-diagonal elements
249
We can define the mean of a random variable X as below:
E [X] :=
xdp(x)
To make it more general, if f : R → R is a function, then f (X) is also a random
variable. Its mean can be calculated as below:
E [f (X)] :=
f (x)dp(x)
If X is a discrete random variable, the integral in the above can be replaced by a
summation:
E [X] =
x
xp(x)
We can simply consider rolling a dice, which has equal probabilities of 1/6.
Therefore, the expected outcome of rolling dice is its mean (1 + 2 + 3 + 4 + 5 + 6)
/6 = 3.5.
Variance is defined to measure how much on average f (x) deviates from a
probability distribution’s expected value, as below:
Var [X] = E
(X − E [X])
2
If we take rolling dice as the example, the variance of rolling a dice is [(1–
3.5) 2 + (2–3.5) 2 + (3–3.5) 2 + (4–3.5) 2 + (5–3.5) 2 + (6–3.5) 2 ]/6 = 2.91
Variance only operates on one dimension; however, it would be possible to find
and compute the correlation between two features using covariance. Covariance is
a measure of how much two random variables vary together and defined as follows:
cov (X, Y) = E [(X − E [X]) (Y − E [Y ])]
If X and Y are discrete random variables, the corresponding covariance can be
calculated using the following equation:
cov (X, Y) =
n
i=1
X i − X
Y i − Y
(n − 1)
in which X and Y illustrates the mean of variable X and variable Y, respectively.
Variance and covariance are often represented together by a covariance matrix. In
a covariance matrix, the diagonal elements are variance and off-diagonal elements