

1 Introduction to Laser Micro-to-Nano Manufacturing
37
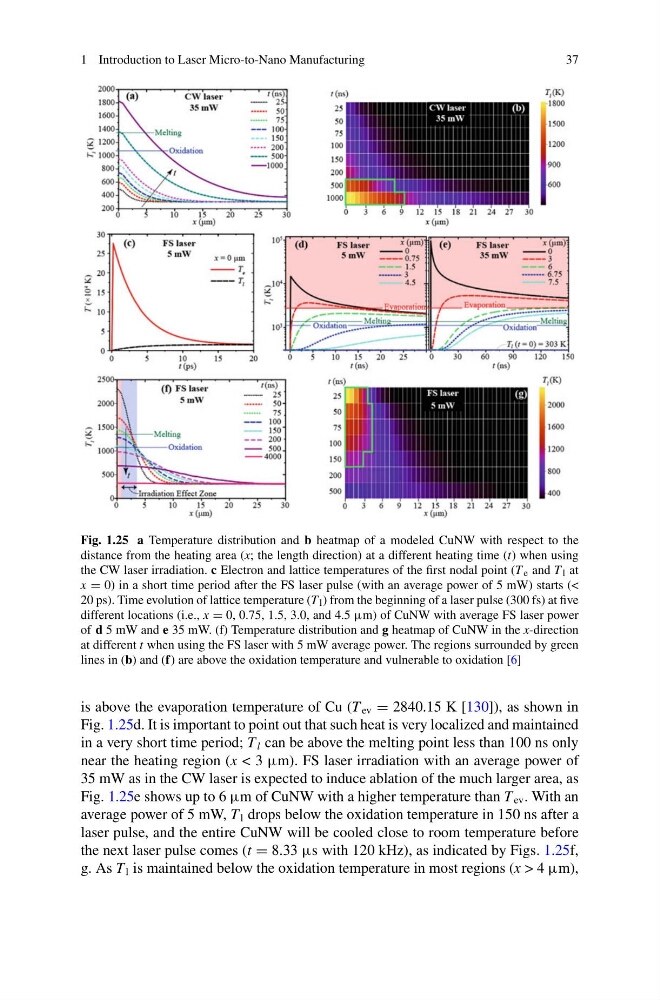
Fig. 1.25 a Temperature distribution and b heatmap of a modeled CuNW with respect to the
distance from the heating area (x; the length direction) at a different heating time (t) when using
the CW laser irradiation. c Electron and lattice temperatures of the first nodal point (T e and T l at
x = 0) in a short time period after the FS laser pulse (with an average power of 5 mW) starts (<
20 ps). Time evolution of lattice temperature (T l ) from the beginning of a laser pulse (300 fs) at five
different locations (i.e., x = 0, 0.75, 1.5, 3.0, and 4.5 μm) of CuNW with average FS laser power
of d 5 mW and e 35 mW. (f) Temperature distribution and g heatmap of CuNW in the x-direction
at different t when using the FS laser with 5 mW average power. The regions surrounded by green
lines in (b) and (f) are above the oxidation temperature and vulnerable to oxidation [6]
is above the evaporation temperature of Cu (T ev = 2840.15 K [130]), as shown in
Fig. 1.25d. It is important to point out that such heat is very localized and maintained
in a very short time period; T l can be above the melting point less than 100 ns only
near the heating region (x < 3 μm). FS laser irradiation with an average power of
35 mW as in the CW laser is expected to induce ablation of the much larger area, as
Fig. 1.25e shows up to 6 μm of CuNW with a higher temperature than T ev . With an
average power of 5 mW, T l drops below the oxidation temperature in 150 ns after a
laser pulse, and the entire CuNW will be cooled close to room temperature before
the next laser pulse comes (t = 8.33 μs with 120 kHz), as indicated by Figs. 1.25f,
g. As T l is maintained below the oxidation temperature in most regions (x > 4 μm),
37
Fig. 1.25 a Temperature distribution and b heatmap of a modeled CuNW with respect to the
distance from the heating area (x; the length direction) at a different heating time (t) when using
the CW laser irradiation. c Electron and lattice temperatures of the first nodal point (T e and T l at
x = 0) in a short time period after the FS laser pulse (with an average power of 5 mW) starts (<
20 ps). Time evolution of lattice temperature (T l ) from the beginning of a laser pulse (300 fs) at five
different locations (i.e., x = 0, 0.75, 1.5, 3.0, and 4.5 μm) of CuNW with average FS laser power
of d 5 mW and e 35 mW. (f) Temperature distribution and g heatmap of CuNW in the x-direction
at different t when using the FS laser with 5 mW average power. The regions surrounded by green
lines in (b) and (f) are above the oxidation temperature and vulnerable to oxidation [6]
is above the evaporation temperature of Cu (T ev = 2840.15 K [130]), as shown in
Fig. 1.25d. It is important to point out that such heat is very localized and maintained
in a very short time period; T l can be above the melting point less than 100 ns only
near the heating region (x < 3 μm). FS laser irradiation with an average power of
35 mW as in the CW laser is expected to induce ablation of the much larger area, as
Fig. 1.25e shows up to 6 μm of CuNW with a higher temperature than T ev . With an
average power of 5 mW, T l drops below the oxidation temperature in 150 ns after a
laser pulse, and the entire CuNW will be cooled close to room temperature before
the next laser pulse comes (t = 8.33 μs with 120 kHz), as indicated by Figs. 1.25f,
g. As T l is maintained below the oxidation temperature in most regions (x > 4 μm),