

11 Lithium-Ion Battery—3D Micro-/Nano-Structuring, Modification …
327
generation, a decrease of 36% in surface area (2D) is expected along with an increase
of over 300% due to the lateral wall contribution (3D) for the structured cathode layer.
The titration technique offers information in relation to the phase diagram, i.e.,
the existing phases in the system. The diffusion coefficient corresponding to the laser
structured material tends to be more sensitive to the phase transitions. At x ~ 0.94
a clear change in the slope is observed, which according to [58, 59] is related to
the first order insulator–metal transition. For the x range between 0.94 and 0.86, the
diffusion coefficient is described by a plateau in quite good agreement with the twophase region described in the previous electrochemical studies. The measurements
by Reynier et al. [60] found this two-phase region in the x range from 0.95 to 0.83,
whereas lower concentration for x = 0.75 or 0.80 was reported by [58, 61] respectively. For a more precise determination of the phase boundaries composition, smaller
titration steps are needed. Nevertheless, in this region, the diffusion coefficients of
the two different material types are the lowest achieved (insert graph in Fig. 11.11).
Below x ~ 0.86 the diffusion coefficient determined for laser structured sample is 5
times higher than for the unstructured. This range in stoichiometry corresponds to
the layered hexagonal single phase [60, 62], where the 3D structures seem to have
an impact on the kinetic properties. Approaching a lower x, i.e. the order–disorder
transition known for x ~ 0.5, the diffusion coefficient of the laser-cell tends to be
more sensitive and shows a change in slope.
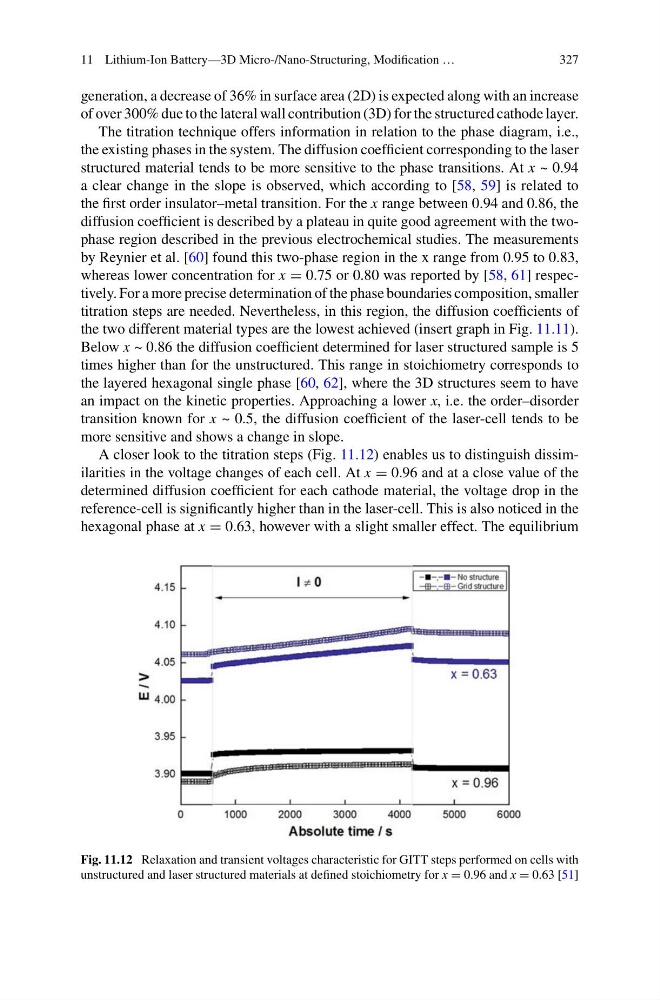
A closer look to the titration steps (Fig. 11.12) enables us to distinguish dissimilarities in the voltage changes of each cell. At x = 0.96 and at a close value of the
determined diffusion coefficient for each cathode material, the voltage drop in the
reference-cell is significantly higher than in the laser-cell. This is also noticed in the
hexagonal phase at x = 0.63, however with a slight smaller effect. The equilibrium
Fig. 11.12 Relaxation and transient voltages characteristic for GITT steps performed on cells with
unstructured and laser structured materials at defined stoichiometry for x = 0.96 and x = 0.63 [51]
327
generation, a decrease of 36% in surface area (2D) is expected along with an increase
of over 300% due to the lateral wall contribution (3D) for the structured cathode layer.
The titration technique offers information in relation to the phase diagram, i.e.,
the existing phases in the system. The diffusion coefficient corresponding to the laser
structured material tends to be more sensitive to the phase transitions. At x ~ 0.94
a clear change in the slope is observed, which according to [58, 59] is related to
the first order insulator–metal transition. For the x range between 0.94 and 0.86, the
diffusion coefficient is described by a plateau in quite good agreement with the twophase region described in the previous electrochemical studies. The measurements
by Reynier et al. [60] found this two-phase region in the x range from 0.95 to 0.83,
whereas lower concentration for x = 0.75 or 0.80 was reported by [58, 61] respectively. For a more precise determination of the phase boundaries composition, smaller
titration steps are needed. Nevertheless, in this region, the diffusion coefficients of
the two different material types are the lowest achieved (insert graph in Fig. 11.11).
Below x ~ 0.86 the diffusion coefficient determined for laser structured sample is 5
times higher than for the unstructured. This range in stoichiometry corresponds to
the layered hexagonal single phase [60, 62], where the 3D structures seem to have
an impact on the kinetic properties. Approaching a lower x, i.e. the order–disorder
transition known for x ~ 0.5, the diffusion coefficient of the laser-cell tends to be
more sensitive and shows a change in slope.
A closer look to the titration steps (Fig. 11.12) enables us to distinguish dissimilarities in the voltage changes of each cell. At x = 0.96 and at a close value of the
determined diffusion coefficient for each cathode material, the voltage drop in the
reference-cell is significantly higher than in the laser-cell. This is also noticed in the
hexagonal phase at x = 0.63, however with a slight smaller effect. The equilibrium
Fig. 11.12 Relaxation and transient voltages characteristic for GITT steps performed on cells with
unstructured and laser structured materials at defined stoichiometry for x = 0.96 and x = 0.63 [51]