

220
G. Feng et al.
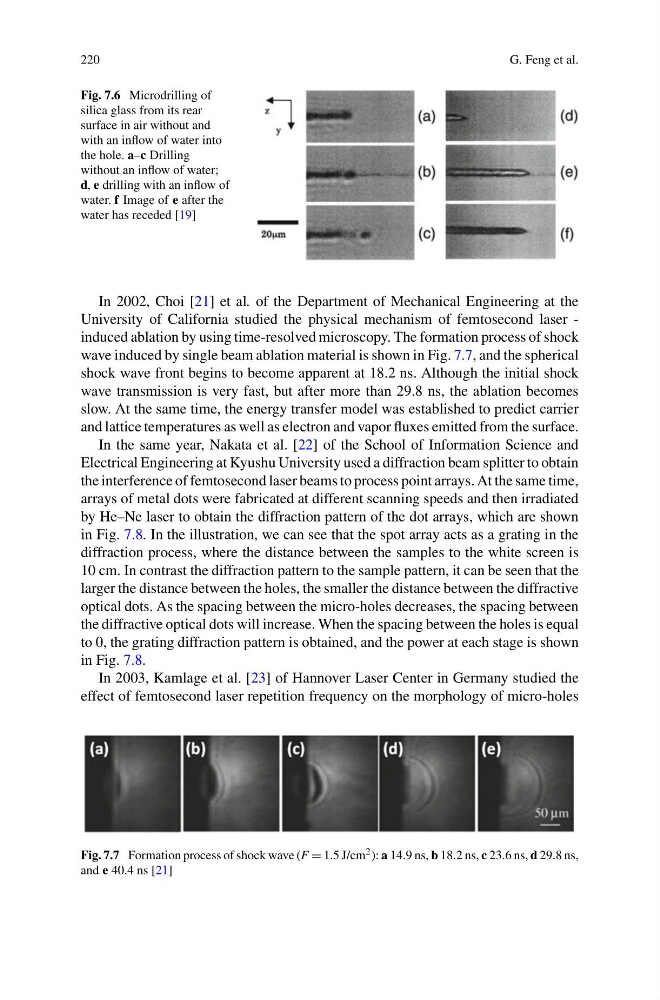
Fig. 7.6 Microdrilling of
silica glass from its rear
surface in air without and
with an inflow of water into
the hole. a–c Drilling
without an inflow of water;
d, e drilling with an inflow of
water. f Image of e after the
water has receded [19]
In 2002, Choi [21] et al. of the Department of Mechanical Engineering at the
University of California studied the physical mechanism of femtosecond laser -
induced ablation by using time-resolved microscopy. The formation process of shock
wave induced by single beam ablation material is shown in Fig. 7.7, and the spherical
shock wave front begins to become apparent at 18.2 ns. Although the initial shock
wave transmission is very fast, but after more than 29.8 ns, the ablation becomes
slow. At the same time, the energy transfer model was established to predict carrier
and lattice temperatures as well as electron and vapor fluxes emitted from the surface.
In the same year, Nakata et al. [22] of the School of Information Science and
Electrical Engineering at Kyushu University used a diffraction beam splitter to obtain
the interference of femtosecond laser beams to process point arrays. At the same time,
arrays of metal dots were fabricated at different scanning speeds and then irradiated
by He–Ne laser to obtain the diffraction pattern of the dot arrays, which are shown
in Fig. 7.8. In the illustration, we can see that the spot array acts as a grating in the
diffraction process, where the distance between the samples to the white screen is
10 cm. In contrast the diffraction pattern to the sample pattern, it can be seen that the
larger the distance between the holes, the smaller the distance between the diffractive
optical dots. As the spacing between the micro-holes decreases, the spacing between
the diffractive optical dots will increase. When the spacing between the holes is equal
to 0, the grating diffraction pattern is obtained, and the power at each stage is shown
in Fig. 7.8.
In 2003, Kamlage et al. [23] of Hannover Laser Center in Germany studied the
effect of femtosecond laser repetition frequency on the morphology of micro-holes
Fig. 7.7 Formation process of shock wave (F = 1.5 J/cm 2 ): a 14.9 ns, b 18.2 ns, c 23.6 ns, d 29.8 ns,
and e 40.4 ns [21]
G. Feng et al.
Fig. 7.6 Microdrilling of
silica glass from its rear
surface in air without and
with an inflow of water into
the hole. a–c Drilling
without an inflow of water;
d, e drilling with an inflow of
water. f Image of e after the
water has receded [19]
In 2002, Choi [21] et al. of the Department of Mechanical Engineering at the
University of California studied the physical mechanism of femtosecond laser -
induced ablation by using time-resolved microscopy. The formation process of shock
wave induced by single beam ablation material is shown in Fig. 7.7, and the spherical
shock wave front begins to become apparent at 18.2 ns. Although the initial shock
wave transmission is very fast, but after more than 29.8 ns, the ablation becomes
slow. At the same time, the energy transfer model was established to predict carrier
and lattice temperatures as well as electron and vapor fluxes emitted from the surface.
In the same year, Nakata et al. [22] of the School of Information Science and
Electrical Engineering at Kyushu University used a diffraction beam splitter to obtain
the interference of femtosecond laser beams to process point arrays. At the same time,
arrays of metal dots were fabricated at different scanning speeds and then irradiated
by He–Ne laser to obtain the diffraction pattern of the dot arrays, which are shown
in Fig. 7.8. In the illustration, we can see that the spot array acts as a grating in the
diffraction process, where the distance between the samples to the white screen is
10 cm. In contrast the diffraction pattern to the sample pattern, it can be seen that the
larger the distance between the holes, the smaller the distance between the diffractive
optical dots. As the spacing between the micro-holes decreases, the spacing between
the diffractive optical dots will increase. When the spacing between the holes is equal
to 0, the grating diffraction pattern is obtained, and the power at each stage is shown
in Fig. 7.8.
In 2003, Kamlage et al. [23] of Hannover Laser Center in Germany studied the
effect of femtosecond laser repetition frequency on the morphology of micro-holes
Fig. 7.7 Formation process of shock wave (F = 1.5 J/cm 2 ): a 14.9 ns, b 18.2 ns, c 23.6 ns, d 29.8 ns,
and e 40.4 ns [21]