

4 Laser-Induced Synthesis and Processing of Nanoparticles …
145
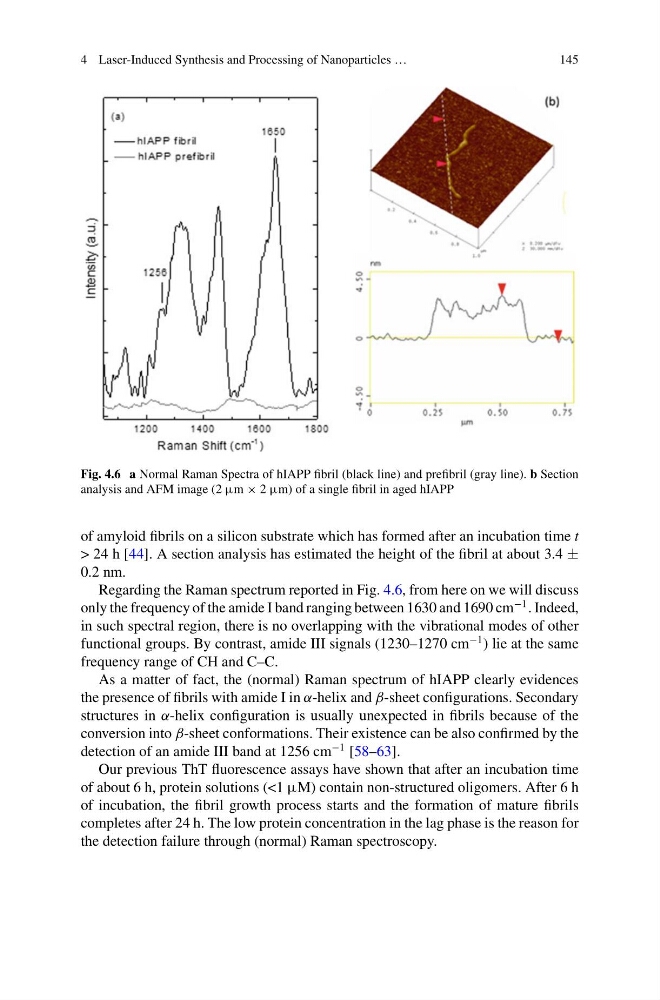
Fig. 4.6 a Normal Raman Spectra of hIAPP fibril (black line) and prefibril (gray line). b Section
analysis and AFM image (2 µm × 2 µm) of a single fibril in aged hIAPP
of amyloid fibrils on a silicon substrate which has formed after an incubation time t
> 24 h [44]. A section analysis has estimated the height of the fibril at about 3.4 ±
0.2 nm.
Regarding the Raman spectrum reported in Fig. 4.6, from here on we will discuss
only the frequency of the amide I band ranging between 1630 and 1690 cm
−1 . Indeed,
in such spectral region, there is no overlapping with the vibrational modes of other
functional groups. By contrast, amide III signals (1230–1270 cm
−1 ) lie at the same
frequency range of CH and C–C.
As a matter of fact, the (normal) Raman spectrum of hIAPP clearly evidences
the presence of fibrils with amide I in α-helix and β-sheet configurations. Secondary
structures in α-helix configuration is usually unexpected in fibrils because of the
conversion into β-sheet conformations. Their existence can be also confirmed by the
detection of an amide III band at 1256 cm
−1 [58–63].
Our previous ThT fluorescence assays have shown that after an incubation time
of about 6 h, protein solutions (<1 µM) contain non-structured oligomers. After 6 h
of incubation, the fibril growth process starts and the formation of mature fibrils
completes after 24 h. The low protein concentration in the lag phase is the reason for
the detection failure through (normal) Raman spectroscopy.
145
Fig. 4.6 a Normal Raman Spectra of hIAPP fibril (black line) and prefibril (gray line). b Section
analysis and AFM image (2 µm × 2 µm) of a single fibril in aged hIAPP
of amyloid fibrils on a silicon substrate which has formed after an incubation time t
> 24 h [44]. A section analysis has estimated the height of the fibril at about 3.4 ±
0.2 nm.
Regarding the Raman spectrum reported in Fig. 4.6, from here on we will discuss
only the frequency of the amide I band ranging between 1630 and 1690 cm
−1 . Indeed,
in such spectral region, there is no overlapping with the vibrational modes of other
functional groups. By contrast, amide III signals (1230–1270 cm
−1 ) lie at the same
frequency range of CH and C–C.
As a matter of fact, the (normal) Raman spectrum of hIAPP clearly evidences
the presence of fibrils with amide I in α-helix and β-sheet configurations. Secondary
structures in α-helix configuration is usually unexpected in fibrils because of the
conversion into β-sheet conformations. Their existence can be also confirmed by the
detection of an amide III band at 1256 cm
−1 [58–63].
Our previous ThT fluorescence assays have shown that after an incubation time
of about 6 h, protein solutions (<1 µM) contain non-structured oligomers. After 6 h
of incubation, the fibril growth process starts and the formation of mature fibrils
completes after 24 h. The low protein concentration in the lag phase is the reason for
the detection failure through (normal) Raman spectroscopy.