

48
3 Simulating Droplet Microfluidic Networks
0
10
20
30
40
50
60
70
80
15
20
25
30
35
40
45
Total time [sec]
Number of cascaded trapping wells
100mBar
200mBar
300mBar
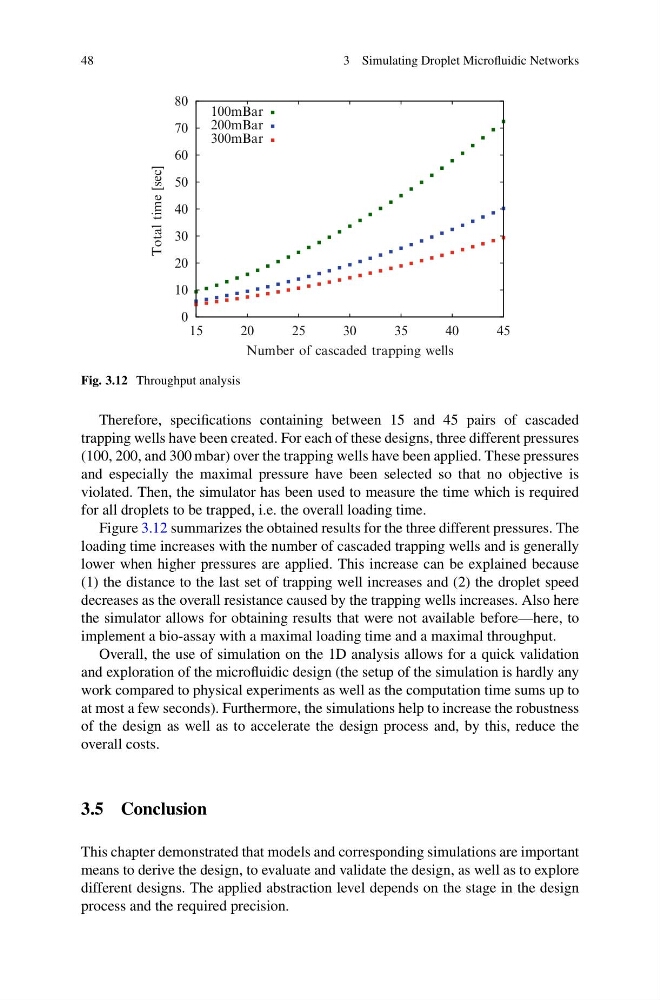
Fig. 3.12 Throughput analysis
Therefore, specifications containing between 15 and 45 pairs of cascaded
trapping wells have been created. For each of these designs, three different pressures
(100, 200, and 300 mbar) over the trapping wells have been applied. These pressures
and especially the maximal pressure have been selected so that no objective is
violated. Then, the simulator has been used to measure the time which is required
for all droplets to be trapped, i.e. the overall loading time.
Figure 3.12 summarizes the obtained results for the three different pressures. The
loading time increases with the number of cascaded trapping wells and is generally
lower when higher pressures are applied. This increase can be explained because
(1) the distance to the last set of trapping well increases and (2) the droplet speed
decreases as the overall resistance caused by the trapping wells increases. Also here
the simulator allows for obtaining results that were not available before—here, to
implement a bio-assay with a maximal loading time and a maximal throughput.
Overall, the use of simulation on the 1D analysis allows for a quick validation
and exploration of the microfluidic design (the setup of the simulation is hardly any
work compared to physical experiments as well as the computation time sums up to
at most a few seconds). Furthermore, the simulations help to increase the robustness
of the design as well as to accelerate the design process and, by this, reduce the
overall costs.
3.5 Conclusion
This chapter demonstrated that models and corresponding simulations are important
means to derive the design, to evaluate and validate the design, as well as to explore
different designs. The applied abstraction level depends on the stage in the design
process and the required precision.
3 Simulating Droplet Microfluidic Networks
0
10
20
30
40
50
60
70
80
15
20
25
30
35
40
45
Total time [sec]
Number of cascaded trapping wells
100mBar
200mBar
300mBar
Fig. 3.12 Throughput analysis
Therefore, specifications containing between 15 and 45 pairs of cascaded
trapping wells have been created. For each of these designs, three different pressures
(100, 200, and 300 mbar) over the trapping wells have been applied. These pressures
and especially the maximal pressure have been selected so that no objective is
violated. Then, the simulator has been used to measure the time which is required
for all droplets to be trapped, i.e. the overall loading time.
Figure 3.12 summarizes the obtained results for the three different pressures. The
loading time increases with the number of cascaded trapping wells and is generally
lower when higher pressures are applied. This increase can be explained because
(1) the distance to the last set of trapping well increases and (2) the droplet speed
decreases as the overall resistance caused by the trapping wells increases. Also here
the simulator allows for obtaining results that were not available before—here, to
implement a bio-assay with a maximal loading time and a maximal throughput.
Overall, the use of simulation on the 1D analysis allows for a quick validation
and exploration of the microfluidic design (the setup of the simulation is hardly any
work compared to physical experiments as well as the computation time sums up to
at most a few seconds). Furthermore, the simulations help to increase the robustness
of the design as well as to accelerate the design process and, by this, reduce the
overall costs.
3.5 Conclusion
This chapter demonstrated that models and corresponding simulations are important
means to derive the design, to evaluate and validate the design, as well as to explore
different designs. The applied abstraction level depends on the stage in the design
process and the required precision.