

114
8 Generating Droplet Sequences
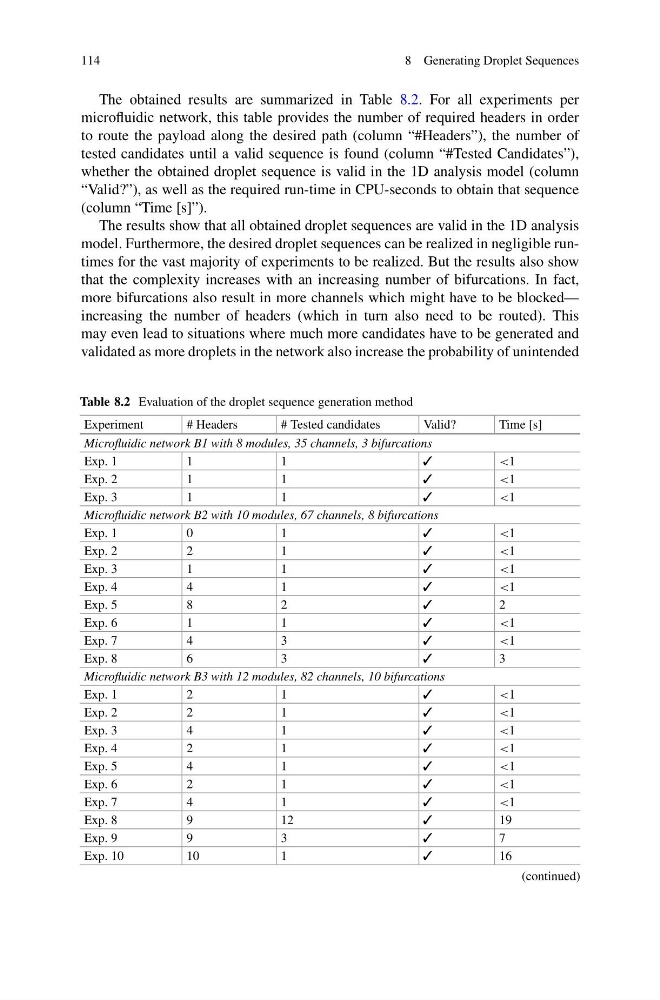
The obtained results are summarized in Table 8.2. For all experiments per
microfluidic network, this table provides the number of required headers in order
to route the payload along the desired path (column “#Headers”), the number of
tested candidates until a valid sequence is found (column “#Tested Candidates”),
whether the obtained droplet sequence is valid in the 1D analysis model (column
“Valid?”), as well as the required run-time in CPU-seconds to obtain that sequence
(column “Time [s]”).
The results show that all obtained droplet sequences are valid in the 1D analysis
model. Furthermore, the desired droplet sequences can be realized in negligible runtimes for the vast majority of experiments to be realized. But the results also show
that the complexity increases with an increasing number of bifurcations. In fact,
more bifurcations also result in more channels which might have to be blocked—
increasing the number of headers (which in turn also need to be routed). This
may even lead to situations where much more candidates have to be generated and
validated as more droplets in the network also increase the probability of unintended
Table 8.2 Evaluation of the droplet sequence generation method
Experiment
# Headers
# Tested candidates
Valid?
Time [s]
Microfluidic network B1 with 8 modules, 35 channels, 3 bifurcations
Exp. 1
1
1
✓
<1
Exp. 2
1
1
✓
<1
Exp. 3
1
1
✓
<1
Microfluidic network B2 with 10 modules, 67 channels, 8 bifurcations
Exp. 1
0
1
✓
<1
Exp. 2
2
1
✓
<1
Exp. 3
1
1
✓
<1
Exp. 4
4
1
✓
<1
Exp. 5
8
2
✓
2
Exp. 6
1
1
✓
<1
Exp. 7
4
3
✓
<1
Exp. 8
6
3
✓
3
Microfluidic network B3 with 12 modules, 82 channels, 10 bifurcations
Exp. 1
2
1
✓
<1
Exp. 2
2
1
✓
<1
Exp. 3
4
1
✓
<1
Exp. 4
2
1
✓
<1
Exp. 5
4
1
✓
<1
Exp. 6
2
1
✓
<1
Exp. 7
4
1
✓
<1
Exp. 8
9
12
✓
19
Exp. 9
9
3
✓
7
Exp. 10
10
1
✓
16
(continued)
8 Generating Droplet Sequences
The obtained results are summarized in Table 8.2. For all experiments per
microfluidic network, this table provides the number of required headers in order
to route the payload along the desired path (column “#Headers”), the number of
tested candidates until a valid sequence is found (column “#Tested Candidates”),
whether the obtained droplet sequence is valid in the 1D analysis model (column
“Valid?”), as well as the required run-time in CPU-seconds to obtain that sequence
(column “Time [s]”).
The results show that all obtained droplet sequences are valid in the 1D analysis
model. Furthermore, the desired droplet sequences can be realized in negligible runtimes for the vast majority of experiments to be realized. But the results also show
that the complexity increases with an increasing number of bifurcations. In fact,
more bifurcations also result in more channels which might have to be blocked—
increasing the number of headers (which in turn also need to be routed). This
may even lead to situations where much more candidates have to be generated and
validated as more droplets in the network also increase the probability of unintended
Table 8.2 Evaluation of the droplet sequence generation method
Experiment
# Headers
# Tested candidates
Valid?
Time [s]
Microfluidic network B1 with 8 modules, 35 channels, 3 bifurcations
Exp. 1
1
1
✓
<1
Exp. 2
1
1
✓
<1
Exp. 3
1
1
✓
<1
Microfluidic network B2 with 10 modules, 67 channels, 8 bifurcations
Exp. 1
0
1
✓
<1
Exp. 2
2
1
✓
<1
Exp. 3
1
1
✓
<1
Exp. 4
4
1
✓
<1
Exp. 5
8
2
✓
2
Exp. 6
1
1
✓
<1
Exp. 7
4
3
✓
<1
Exp. 8
6
3
✓
3
Microfluidic network B3 with 12 modules, 82 channels, 10 bifurcations
Exp. 1
2
1
✓
<1
Exp. 2
2
1
✓
<1
Exp. 3
4
1
✓
<1
Exp. 4
2
1
✓
<1
Exp. 5
4
1
✓
<1
Exp. 6
2
1
✓
<1
Exp. 7
4
1
✓
<1
Exp. 8
9
12
✓
19
Exp. 9
9
3
✓
7
Exp. 10
10
1
✓
16
(continued)