

104
8 Generating Droplet Sequences
c 1
c 2
c 3
Given in
p
h
p
h
p
h
Q 0.6 0.6 0.31 0.29
0.28
0.25 μl/min
v d
4
4 2.12 1.93
1.85
1.69 10 −3 m/s
dur 75 75 82.68 90.45 107.98 118.13 ms
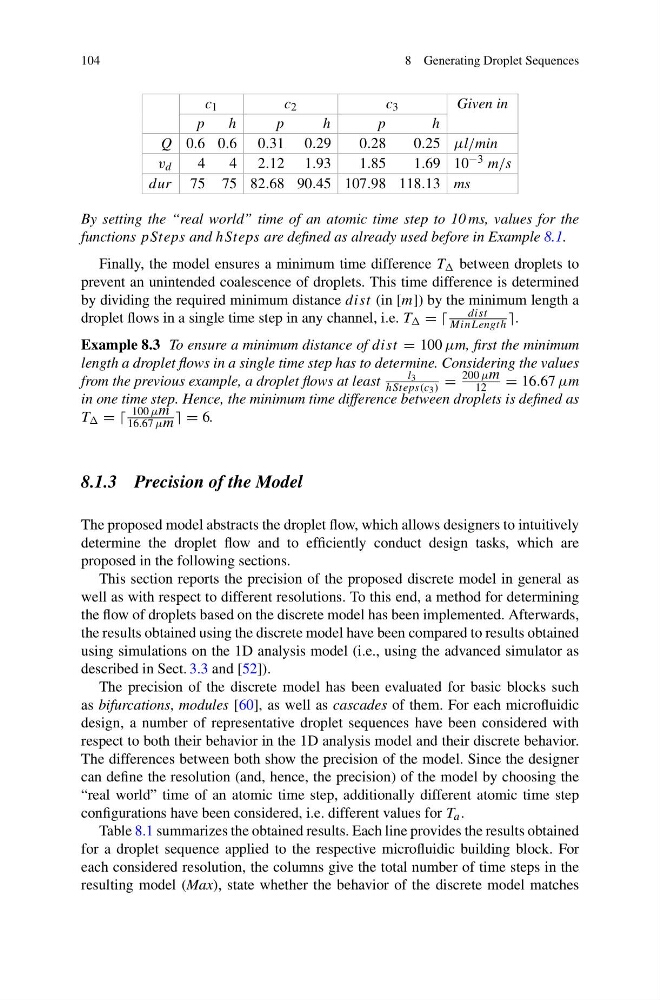
By setting the “real world” time of an atomic time step to 10 ms, values for the
functions pSteps and hSteps are defined as already used before in Example 8.1.
Finally, the model ensures a minimum time difference T between droplets to
prevent an unintended coalescence of droplets. This time difference is determined
by dividing the required minimum distance dist (in [m]) by the minimum length a
droplet flows in a single time step in any channel, i.e. T = =
dist
MinLength .
Example 8.3 To ensure a minimum distance of dist = 100 μm, first the minimum
length a droplet flows in a single time step has to determine. Considering the values
from the previous example, a droplet flows at least
l 3
hSteps(c 3 ) =
200 μm
12
= 16.67 μm
in one time step. Hence, the minimum time difference between droplets is defined as
T = =
100 μm
16.67 μm = 6.
8.1.3 Precision of the Model
The proposed model abstracts the droplet flow, which allows designers to intuitively
determine the droplet flow and to efficiently conduct design tasks, which are
proposed in the following sections.
This section reports the precision of the proposed discrete model in general as
well as with respect to different resolutions. To this end, a method for determining
the flow of droplets based on the discrete model has been implemented. Afterwards,
the results obtained using the discrete model have been compared to results obtained
using simulations on the 1D analysis model (i.e., using the advanced simulator as
described in Sect. 3.3 and [52]).
The precision of the discrete model has been evaluated for basic blocks such
as bifurcations, modules [60], as well as cascades of them. For each microfluidic
design, a number of representative droplet sequences have been considered with
respect to both their behavior in the 1D analysis model and their discrete behavior.
The differences between both show the precision of the model. Since the designer
can define the resolution (and, hence, the precision) of the model by choosing the
“real world” time of an atomic time step, additionally different atomic time step
configurations have been considered, i.e. different values for T a .
Table 8.1 summarizes the obtained results. Each line provides the results obtained
for a droplet sequence applied to the respective microfluidic building block. For
each considered resolution, the columns give the total number of time steps in the
resulting model (Max), state whether the behavior of the discrete model matches
8 Generating Droplet Sequences
c 1
c 2
c 3
Given in
p
h
p
h
p
h
Q 0.6 0.6 0.31 0.29
0.28
0.25 μl/min
v d
4
4 2.12 1.93
1.85
1.69 10 −3 m/s
dur 75 75 82.68 90.45 107.98 118.13 ms
By setting the “real world” time of an atomic time step to 10 ms, values for the
functions pSteps and hSteps are defined as already used before in Example 8.1.
Finally, the model ensures a minimum time difference T between droplets to
prevent an unintended coalescence of droplets. This time difference is determined
by dividing the required minimum distance dist (in [m]) by the minimum length a
droplet flows in a single time step in any channel, i.e. T = =
dist
MinLength .
Example 8.3 To ensure a minimum distance of dist = 100 μm, first the minimum
length a droplet flows in a single time step has to determine. Considering the values
from the previous example, a droplet flows at least
l 3
hSteps(c 3 ) =
200 μm
12
= 16.67 μm
in one time step. Hence, the minimum time difference between droplets is defined as
T = =
100 μm
16.67 μm = 6.
8.1.3 Precision of the Model
The proposed model abstracts the droplet flow, which allows designers to intuitively
determine the droplet flow and to efficiently conduct design tasks, which are
proposed in the following sections.
This section reports the precision of the proposed discrete model in general as
well as with respect to different resolutions. To this end, a method for determining
the flow of droplets based on the discrete model has been implemented. Afterwards,
the results obtained using the discrete model have been compared to results obtained
using simulations on the 1D analysis model (i.e., using the advanced simulator as
described in Sect. 3.3 and [52]).
The precision of the discrete model has been evaluated for basic blocks such
as bifurcations, modules [60], as well as cascades of them. For each microfluidic
design, a number of representative droplet sequences have been considered with
respect to both their behavior in the 1D analysis model and their discrete behavior.
The differences between both show the precision of the model. Since the designer
can define the resolution (and, hence, the precision) of the model by choosing the
“real world” time of an atomic time step, additionally different atomic time step
configurations have been considered, i.e. different values for T a .
Table 8.1 summarizes the obtained results. Each line provides the results obtained
for a droplet sequence applied to the respective microfluidic building block. For
each considered resolution, the columns give the total number of time steps in the
resulting model (Max), state whether the behavior of the discrete model matches