

302
Electrochemical Supercapacitors for Energy Storage and Delivery
n < 1.0, q i can be approximately treated as the capacitance in Ω –1 .s n units. For
a more detailed description of the constant phase element see Reference 8.
7.5.3 Supercapacitor Data Simulation to Obtain Parameter Values
As shown in Figure 7.9, the measured Nyquist plots contain a deformed
semicircle at low frequency ranges and an inclined line at the high frequency
range. Between these two frequencies is a narrow range with an inclined
straight line. Because of the lack of a pseudocapacitance-generating reaction, this deformed semicircle should not be assigned to an electrochemical
process. Note that, in this cell, a stainless steel plate was used as a current
collector that provides less conductivity than other metals such as Al. Ni,
etc. Therefore, it is reasonably believed that this semicircle comes from the
interface between the low conductivity stainless steel plate and the electrode
carbon layer. This was verified by further experimentation with the stainless steel plate replaced by a carbon plate (all other cell conditions remained
constant). The deformed semicircle at the high frequency range disappeared
although the other parts of the Nyquist plot could be still observed.
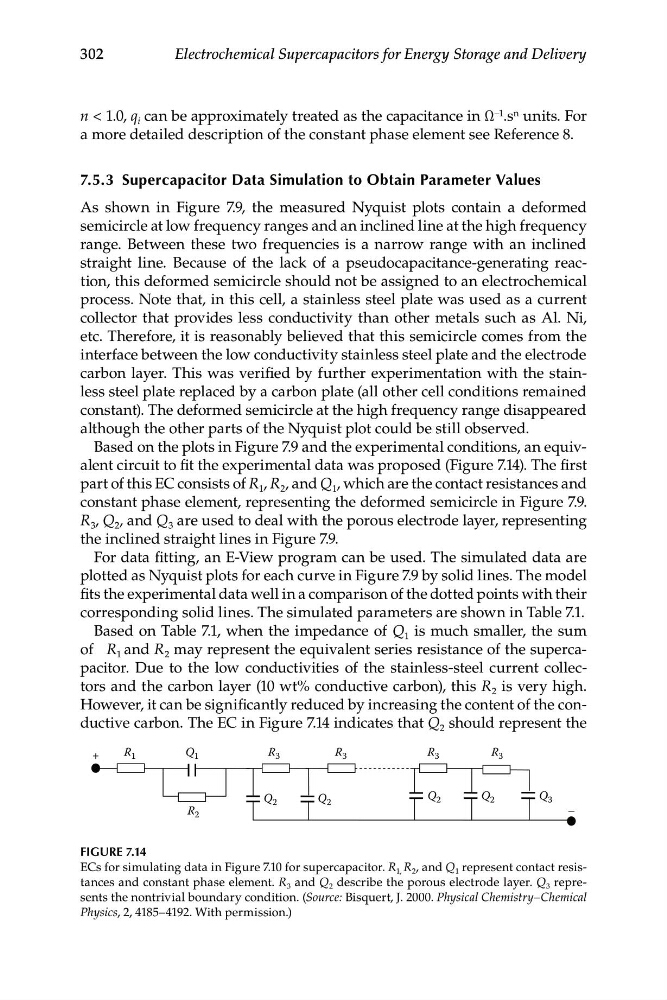
Based on the plots in Figure 7.9 and the experimental conditions, an equivalent circuit to fit the experimental data was proposed (Figure 7.14). The first
part of this EC consists of R 1 , R 2 , and Q 1 , which are the contact resistances and
constant phase element, representing the deformed semicircle in Figure 7.9.
R 3 , Q 2 , and Q 3 are used to deal with the porous electrode layer, representing
the inclined straight lines in Figure 7.9.
For data fitting, an E-View program can be used. The simulated data are
plotted as Nyquist plots for each curve in Figure 7.9 by solid lines. The model
fits the experimental data well in a comparison of the dotted points with their
corresponding solid lines. The simulated parameters are shown in Table 7.1.
Based on Table 7.1, when the impedance of Q 1 is much smaller, the sum
of R 1 and R 2 may represent the equivalent series resistance of the supercapacitor. Due to the low conductivities of the stainless-steel current collectors and the carbon layer (10 wt% conductive carbon), this R 2 is very high.
However, it can be significantly reduced by increasing the content of the conductive carbon. The EC in Figure 7.14 indicates that Q 2 should represent the
+
R 1
Q 1
R 3
R 3
R 3
R 3
Q 2
Q 2
Q 2
Q 2
Q 3
–
R 2
FIGURE 7.14
ECs for simulating data in Figure 7.10 for supercapacitor. R 1, R 2 , and Q 1 represent contact resistances and constant phase element. R 3 and Q 2 describe the porous electrode layer. Q 3 represents the nontrivial boundary condition. (Source: Bisquert, J. 2000. Physical Chemistry–Chemical
Physics, 2, 4185–4192. With permission.)
Electrochemical Supercapacitors for Energy Storage and Delivery
n < 1.0, q i can be approximately treated as the capacitance in Ω –1 .s n units. For
a more detailed description of the constant phase element see Reference 8.
7.5.3 Supercapacitor Data Simulation to Obtain Parameter Values
As shown in Figure 7.9, the measured Nyquist plots contain a deformed
semicircle at low frequency ranges and an inclined line at the high frequency
range. Between these two frequencies is a narrow range with an inclined
straight line. Because of the lack of a pseudocapacitance-generating reaction, this deformed semicircle should not be assigned to an electrochemical
process. Note that, in this cell, a stainless steel plate was used as a current
collector that provides less conductivity than other metals such as Al. Ni,
etc. Therefore, it is reasonably believed that this semicircle comes from the
interface between the low conductivity stainless steel plate and the electrode
carbon layer. This was verified by further experimentation with the stainless steel plate replaced by a carbon plate (all other cell conditions remained
constant). The deformed semicircle at the high frequency range disappeared
although the other parts of the Nyquist plot could be still observed.
Based on the plots in Figure 7.9 and the experimental conditions, an equivalent circuit to fit the experimental data was proposed (Figure 7.14). The first
part of this EC consists of R 1 , R 2 , and Q 1 , which are the contact resistances and
constant phase element, representing the deformed semicircle in Figure 7.9.
R 3 , Q 2 , and Q 3 are used to deal with the porous electrode layer, representing
the inclined straight lines in Figure 7.9.
For data fitting, an E-View program can be used. The simulated data are
plotted as Nyquist plots for each curve in Figure 7.9 by solid lines. The model
fits the experimental data well in a comparison of the dotted points with their
corresponding solid lines. The simulated parameters are shown in Table 7.1.
Based on Table 7.1, when the impedance of Q 1 is much smaller, the sum
of R 1 and R 2 may represent the equivalent series resistance of the supercapacitor. Due to the low conductivities of the stainless-steel current collectors and the carbon layer (10 wt% conductive carbon), this R 2 is very high.
However, it can be significantly reduced by increasing the content of the conductive carbon. The EC in Figure 7.14 indicates that Q 2 should represent the
+
R 1
Q 1
R 3
R 3
R 3
R 3
Q 2
Q 2
Q 2
Q 2
Q 3
–
R 2
FIGURE 7.14
ECs for simulating data in Figure 7.10 for supercapacitor. R 1, R 2 , and Q 1 represent contact resistances and constant phase element. R 3 and Q 2 describe the porous electrode layer. Q 3 represents the nontrivial boundary condition. (Source: Bisquert, J. 2000. Physical Chemistry–Chemical
Physics, 2, 4185–4192. With permission.)