

-Z
Im , Ω.cm
2
0.0
0.5
1.0
1.5
2.0
2.5
3.0
3.5
4.0
5.0
4.5
50 Hz
122 KHz
20 wt% conductive carbon addition
15 wt% conductive carbon addition
10 wt% conductive carbon addition
0.3 Hz
Solid line: Simulated
Dots: Measured
0.0
0.5
1.0
1.5
2.0
2.5
3.0
3.5
4.0
4.5
5.0
Z R , Ω.cm
2
296
Electrochemical Supercapacitors for Energy Storage and Delivery
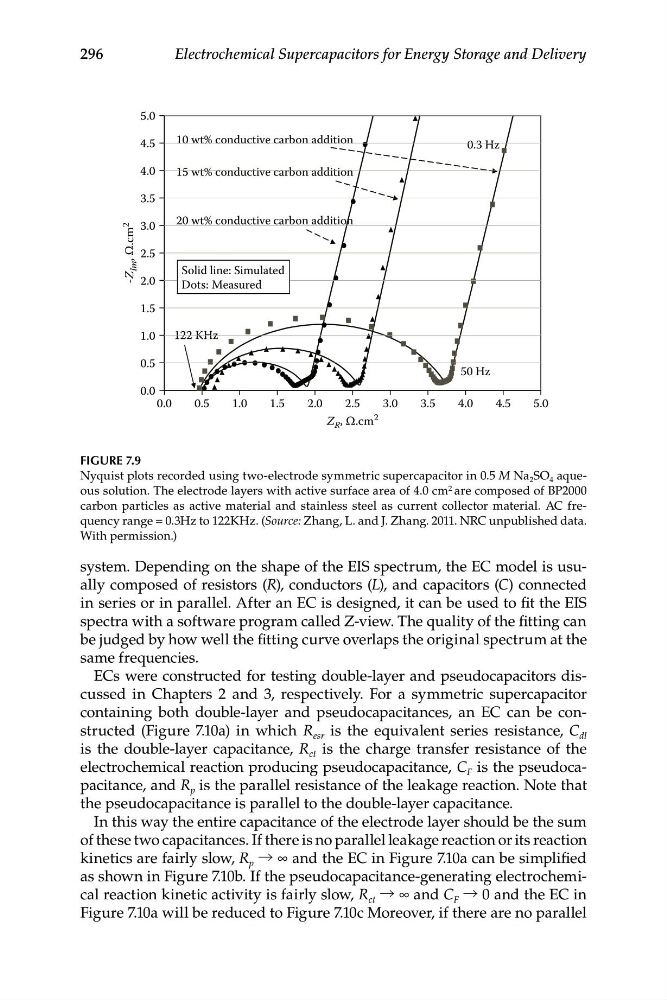
FIGURE 7.9
Nyquist plots recorded using two-electrode symmetric supercapacitor in 0.5 M Na 2 SO 4 aqueous solution. The electrode layers with active surface area of 4.0 cm 2 are composed of BP2000
carbon particles as active material and stainless steel as current collector material. AC frequency range = 0.3Hz to 122KHz. (Source: Zhang, L. and J. Zhang. 2011. NRC unpublished data.
With permission.)
system. Depending on the shape of the EIS spectrum, the EC model is usually composed of resistors (R), conductors (L), and capacitors (C) connected
in series or in parallel. After an EC is designed, it can be used to fit the EIS
spectra with a software program called Z-view. The quality of the fitting can
be judged by how well the fitting curve overlaps the original spectrum at the
same frequencies.
ECs were constructed for testing double-layer and pseudocapacitors discussed in Chapters 2 and 3, respectively. For a symmetric supercapacitor
containing both double-layer and pseudocapacitances, an EC can be constructed (Figure 7.10a) in which R esr is the equivalent series resistance, C dl
is the double-layer capacitance, R ct is the charge transfer resistance of the
electrochemical reaction producing pseudocapacitance, C F is the pseudocapacitance, and R p is the parallel resistance of the leakage reaction. Note that
the pseudocapacitance is parallel to the double-layer capacitance.
In this way the entire capacitance of the electrode layer should be the sum
of these two capacitances. If there is no parallel leakage reaction or its reaction
kinetics are fairly slow, R p → ∞ and the EC in Figure 7.10a can be simplified
as shown in Figure 7.10b. If the pseudocapacitance-generating electrochemical reaction kinetic activity is fairly slow, R ct → ∞ and C F → 0 and the EC in
Figure 7.10a will be reduced to Figure 7.10c Moreover, if there are no parallel