

Leakage Current (mA)
10
1
0.1
0.01
0.001
2.8
3.8
4
4.2
4.4
2.5 V
2.6 V
2.7 V
2.8 V
2.9 V
3.0 V
3
3.2
3.4
3.6
1/Temperature (1000/°K)
223
Electrochemical Supercapacitor Design, Fabrication, and Operation
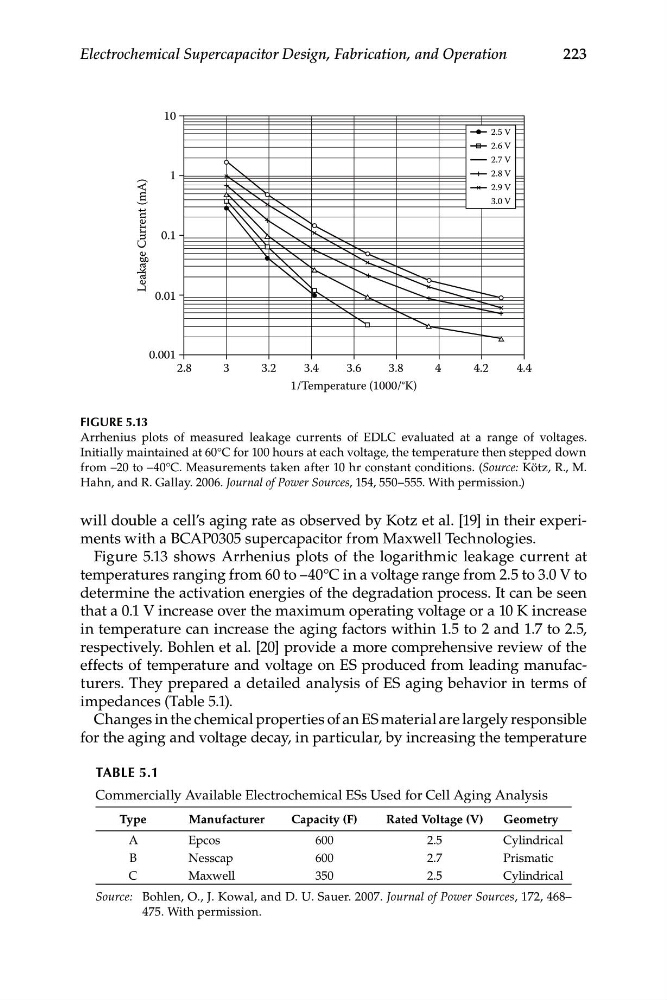
FIGURE 5.13
Arrhenius plots of measured leakage currents of EDLC evaluated at a range of voltages.
Initially maintained at 60°C for 100 hours at each voltage, the temperature then stepped down
from –20 to –40°C. Measurements taken after 10 hr constant conditions. (Source: Kötz, R., M.
Hahn, and R. Gallay. 2006. Journal of Power Sources, 154, 550–555. With permission.)
will double a cell’s aging rate as observed by Kotz et al. [19] in their experiments with a BCAP0305 supercapacitor from Maxwell Technologies.
Figure 5.13 shows Arrhenius plots of the logarithmic leakage current at
temperatures ranging from 60 to –40°C in a voltage range from 2.5 to 3.0 V to
determine the activation energies of the degradation process. It can be seen
that a 0.1 V increase over the maximum operating voltage or a 10 K increase
in temperature can increase the aging factors within 1.5 to 2 and 1.7 to 2.5,
respectively. Bohlen et al. [20] provide a more comprehensive review of the
effects of temperature and voltage on ES produced from leading manufacturers. They prepared a detailed analysis of ES aging behavior in terms of
impedances (Table 5.1).
Changes in the chemical properties of an ES material are largely responsible
for the aging and voltage decay, in particular, by increasing the temperature
TABLE 5.1
Commercially Available Electrochemical ESs Used for Cell Aging Analysis
Type
Manufacturer
Capacity (F)
Rated Voltage (V)
Geometry
A
Epcos
600
2.5
Cylindrical
B
Nesscap
600
2.7
Prismatic
C
Maxwell
350
2.5
Cylindrical
Source: Bohlen, O., J. Kowal, and D. U. Sauer. 2007. Journal of Power Sources, 172, 468–
475. With permission.
10
1
0.1
0.01
0.001
2.8
3.8
4
4.2
4.4
2.5 V
2.6 V
2.7 V
2.8 V
2.9 V
3.0 V
3
3.2
3.4
3.6
1/Temperature (1000/°K)
223
Electrochemical Supercapacitor Design, Fabrication, and Operation
FIGURE 5.13
Arrhenius plots of measured leakage currents of EDLC evaluated at a range of voltages.
Initially maintained at 60°C for 100 hours at each voltage, the temperature then stepped down
from –20 to –40°C. Measurements taken after 10 hr constant conditions. (Source: Kötz, R., M.
Hahn, and R. Gallay. 2006. Journal of Power Sources, 154, 550–555. With permission.)
will double a cell’s aging rate as observed by Kotz et al. [19] in their experiments with a BCAP0305 supercapacitor from Maxwell Technologies.
Figure 5.13 shows Arrhenius plots of the logarithmic leakage current at
temperatures ranging from 60 to –40°C in a voltage range from 2.5 to 3.0 V to
determine the activation energies of the degradation process. It can be seen
that a 0.1 V increase over the maximum operating voltage or a 10 K increase
in temperature can increase the aging factors within 1.5 to 2 and 1.7 to 2.5,
respectively. Bohlen et al. [20] provide a more comprehensive review of the
effects of temperature and voltage on ES produced from leading manufacturers. They prepared a detailed analysis of ES aging behavior in terms of
impedances (Table 5.1).
Changes in the chemical properties of an ES material are largely responsible
for the aging and voltage decay, in particular, by increasing the temperature
TABLE 5.1
Commercially Available Electrochemical ESs Used for Cell Aging Analysis
Type
Manufacturer
Capacity (F)
Rated Voltage (V)
Geometry
A
Epcos
600
2.5
Cylindrical
B
Nesscap
600
2.7
Prismatic
C
Maxwell
350
2.5
Cylindrical
Source: Bohlen, O., J. Kowal, and D. U. Sauer. 2007. Journal of Power Sources, 172, 468–
475. With permission.