

–
–
–
–
–
–
–
–
–
–
–
–
+
+
+
+
+
+
+
+
+
+
+
+
+
+
+
+
+
–
–
35 45
d
a
b
15
10
F
0
1
2
–
–
–
–
δ–
δ–
δ–
δ–
+
δ–
δ–
δ–
δ–
+
–
+
+
I
II
E
D
5
0
Normalized Capacitance (μF cm
–2
)
1.5 M
1.5 M
1.5 M
1.0 & 1.4 M
1.7 M
III
IV
B
C
3
Average Pore Size (nm)
–
4
5 15 25
A
145
Components and Materials for Electrochemical Supercapacitors
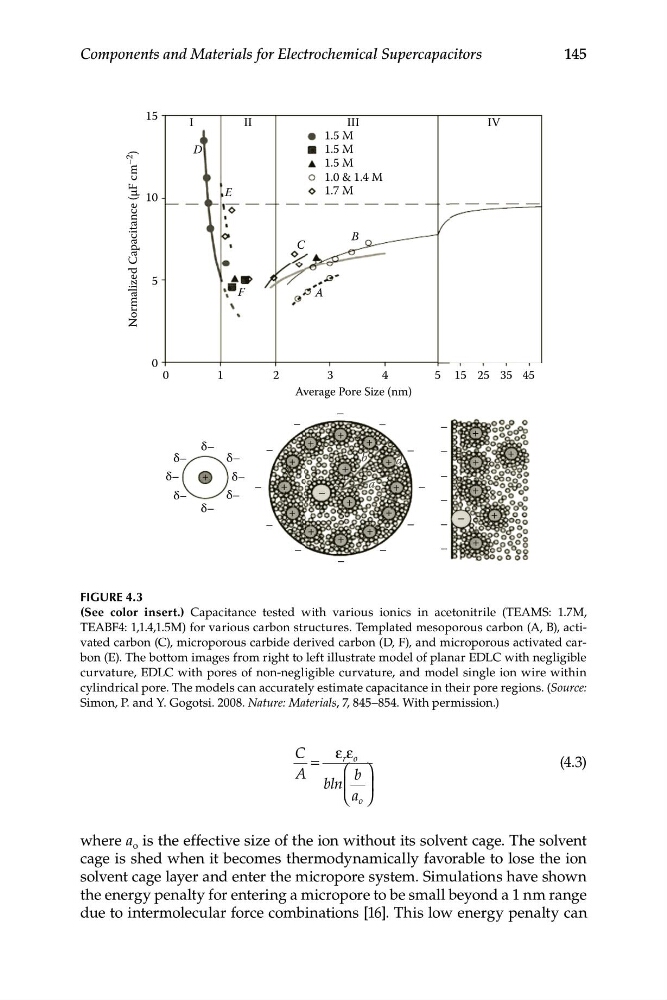
FIGURE 4.3
(See color insert.) Capacitance tested with various ionics in acetonitrile (TEAMS: 1.7M,
TEABF4: 1,1.4,1.5M) for various carbon structures. Templated mesoporous carbon (A, B), activated carbon (C), microporous carbide derived carbon (D, F), and microporous activated carbon (E). The bottom images from right to left illustrate model of planar EDLC with negligible
curvature, EDLC with pores of non-negligible curvature, and model single ion wire within
cylindrical pore. The models can accurately estimate capacitance in their pore regions. (Source:
Simon, P. and Y. Gogotsi. 2008. Nature: Materials, 7, 845–854. With permission.)
C
ε ε
=
r o
(4.3)
A
⎛ b ⎞
bln ⎜ ⎟
⎝ a o ⎠
where a o is the effective size of the ion without its solvent cage. The solvent
cage is shed when it becomes thermodynamically favorable to lose the ion
solvent cage layer and enter the micropore system. Simulations have shown
the energy penalty for entering a micropore to be small beyond a 1 nm range
due to intermolecular force combinations [16]. This low energy penalty can
–
–
–
–
–
–
–
–
–
–
–
+
+
+
+
+
+
+
+
+
+
+
+
+
+
+
+
+
–
–
35 45
d
a
b
15
10
F
0
1
2
–
–
–
–
δ–
δ–
δ–
δ–
+
δ–
δ–
δ–
δ–
+
–
+
+
I
II
E
D
5
0
Normalized Capacitance (μF cm
–2
)
1.5 M
1.5 M
1.5 M
1.0 & 1.4 M
1.7 M
III
IV
B
C
3
Average Pore Size (nm)
–
4
5 15 25
A
145
Components and Materials for Electrochemical Supercapacitors
FIGURE 4.3
(See color insert.) Capacitance tested with various ionics in acetonitrile (TEAMS: 1.7M,
TEABF4: 1,1.4,1.5M) for various carbon structures. Templated mesoporous carbon (A, B), activated carbon (C), microporous carbide derived carbon (D, F), and microporous activated carbon (E). The bottom images from right to left illustrate model of planar EDLC with negligible
curvature, EDLC with pores of non-negligible curvature, and model single ion wire within
cylindrical pore. The models can accurately estimate capacitance in their pore regions. (Source:
Simon, P. and Y. Gogotsi. 2008. Nature: Materials, 7, 845–854. With permission.)
C
ε ε
=
r o
(4.3)
A
⎛ b ⎞
bln ⎜ ⎟
⎝ a o ⎠
where a o is the effective size of the ion without its solvent cage. The solvent
cage is shed when it becomes thermodynamically favorable to lose the ion
solvent cage layer and enter the micropore system. Simulations have shown
the energy penalty for entering a micropore to be small beyond a 1 nm range
due to intermolecular force combinations [16]. This low energy penalty can