

4.5 Influence of Growth Conditions on Epitaxial Layer Quality …
57
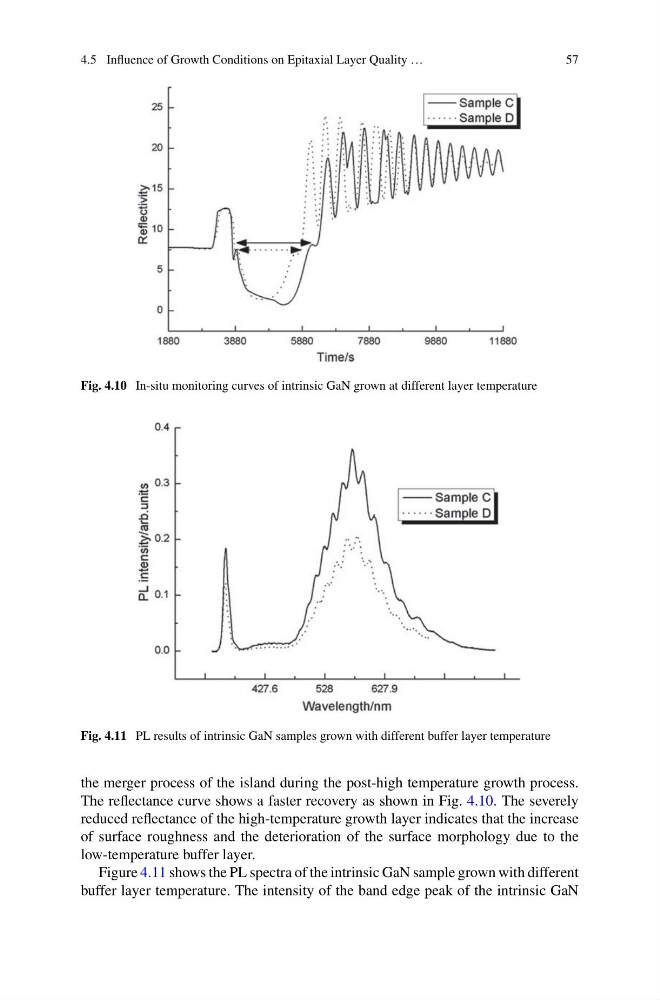
Fig. 4.10 In-situ monitoring curves of intrinsic GaN grown at different layer temperature
Fig. 4.11 PL results of intrinsic GaN samples grown with different buffer layer temperature
the merger process of the island during the post-high temperature growth process.
The reflectance curve shows a faster recovery as shown in Fig. 4.10. The severely
reduced reflectance of the high-temperature growth layer indicates that the increase
of surface roughness and the deterioration of the surface morphology due to the
low-temperature buffer layer.
Figure 4.11 shows the PL spectra of the intrinsic GaN sample grown with different
buffer layer temperature. The intensity of the band edge peak of the intrinsic GaN
57
Fig. 4.10 In-situ monitoring curves of intrinsic GaN grown at different layer temperature
Fig. 4.11 PL results of intrinsic GaN samples grown with different buffer layer temperature
the merger process of the island during the post-high temperature growth process.
The reflectance curve shows a faster recovery as shown in Fig. 4.10. The severely
reduced reflectance of the high-temperature growth layer indicates that the increase
of surface roughness and the deterioration of the surface morphology due to the
low-temperature buffer layer.
Figure 4.11 shows the PL spectra of the intrinsic GaN sample grown with different
buffer layer temperature. The intensity of the band edge peak of the intrinsic GaN