

224
10 Reliability Analysis of Group III Nitride LEDs Devices
It should be noted that, the two failures of the light source can affect each other.
For example, after inducing the failure caused by the aging of the light source, the
light source can no longer induce the failure caused by the abrupt failure, and vice
versa. Therefore, the failure of the light source uses the NAND gate to describe the
relationship between the abrupt failure and the aging failure.
According to the regression method of least squares for each critical failure mode,
it can be seen that the failure data that changes over time is fitted into (and conforms
to) the Weibull distribution.
f (t) =
bt
b−1
a b e
−(
t
a )
b
h(t) =
bt
b−1
a b .
(10.23)
when b > 1, the failure rate increases. Since the failure rate is not constant, the
probability function can be expressed as:
P(t) = exp{Q · t} =
∞
k=0
Q
k t
k
k!
(10.24)
where Q is the transition-strength matrix.
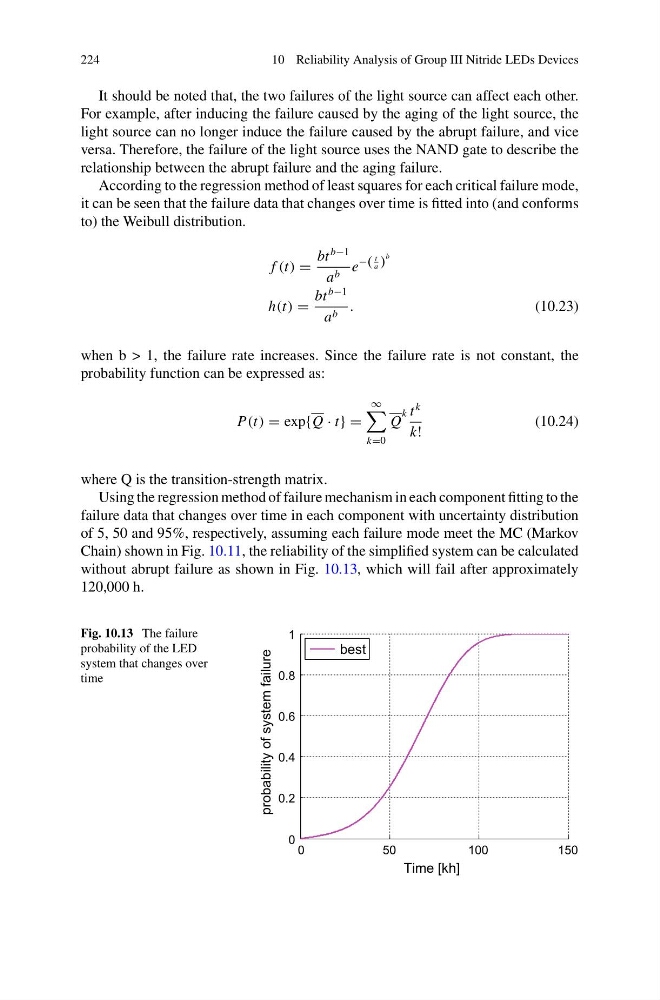
Using the regression method of failure mechanism in each component fitting to the
failure data that changes over time in each component with uncertainty distribution
of 5, 50 and 95%, respectively, assuming each failure mode meet the MC (Markov
Chain) shown in Fig. 10.11, the reliability of the simplified system can be calculated
without abrupt failure as shown in Fig. 10.13, which will fail after approximately
120,000 h.
Fig. 10.13 The failure
probability of the LED
system that changes over
time
0
50
100
150
0
0.2
0.4
0.6
0.8
1
Time [kh]
probability of system failure
best
10 Reliability Analysis of Group III Nitride LEDs Devices
It should be noted that, the two failures of the light source can affect each other.
For example, after inducing the failure caused by the aging of the light source, the
light source can no longer induce the failure caused by the abrupt failure, and vice
versa. Therefore, the failure of the light source uses the NAND gate to describe the
relationship between the abrupt failure and the aging failure.
According to the regression method of least squares for each critical failure mode,
it can be seen that the failure data that changes over time is fitted into (and conforms
to) the Weibull distribution.
f (t) =
bt
b−1
a b e
−(
t
a )
b
h(t) =
bt
b−1
a b .
(10.23)
when b > 1, the failure rate increases. Since the failure rate is not constant, the
probability function can be expressed as:
P(t) = exp{Q · t} =
∞
k=0
Q
k t
k
k!
(10.24)
where Q is the transition-strength matrix.
Using the regression method of failure mechanism in each component fitting to the
failure data that changes over time in each component with uncertainty distribution
of 5, 50 and 95%, respectively, assuming each failure mode meet the MC (Markov
Chain) shown in Fig. 10.11, the reliability of the simplified system can be calculated
without abrupt failure as shown in Fig. 10.13, which will fail after approximately
120,000 h.
Fig. 10.13 The failure
probability of the LED
system that changes over
time
0
50
100
150
0
0.2
0.4
0.6
0.8
1
Time [kh]
probability of system failure
best