

64
H. Takiyama
3.4.5.1 Method A (Constant Addition Rate)
In Run 1, precipitation of α-form was not observed during the experiment. It became
clear that γ -form can be selectively obtained from this result by using an anti-solvent
addition rate with which solution composition does not approach the solubility of
α-form.
In Run 2 and Run 3, α-form deposited during the experiment (Table 3.2). In
order to obtain γ -form in stability, there is an anti-solvent addition rate that does not
exceed the solubility curve of α-form. It is confirmed that it is important to control
the solution composition in the operation area where only γ -form deposits using
the ternary phase diagram and the simulation. However, under the conditions of a
constant addition rate, the batch operation time becomes long.
3.4.5.2 Method B (Gradual Change of Addition Rate)
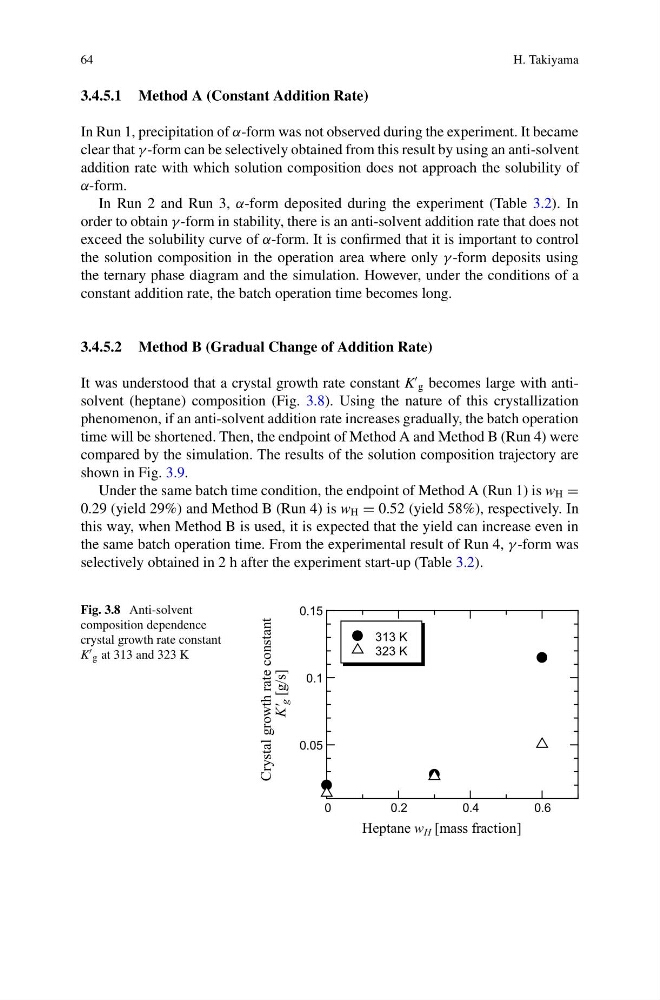
It was understood that a crystal growth rate constant K
g becomes large with antisolvent (heptane) composition (Fig. 3.8). Using the nature of this crystallization
phenomenon, if an anti-solvent addition rate increases gradually, the batch operation
time will be shortened. Then, the endpoint of Method A and Method B (Run 4) were
compared by the simulation. The results of the solution composition trajectory are
shown in Fig. 3.9.
Under the same batch time condition, the endpoint of Method A (Run 1) is w H =
0.29 (yield 29%) and Method B (Run 4) is w H = 0.52 (yield 58%), respectively. In
this way, when Method B is used, it is expected that the yield can increase even in
the same batch operation time. From the experimental result of Run 4, γ -form was
selectively obtained in 2 h after the experiment start-up (Table 3.2).
Fig. 3.8 Anti-solvent
composition dependence
crystal growth rate constant
K g at 313 and 323 K
0
0.2
0.4
0.6
0.05
0.1
0.15
Crystal growth rate constant
K'
g [g/s]
Heptane w H [mass fraction]
313 K
323 K
H. Takiyama
3.4.5.1 Method A (Constant Addition Rate)
In Run 1, precipitation of α-form was not observed during the experiment. It became
clear that γ -form can be selectively obtained from this result by using an anti-solvent
addition rate with which solution composition does not approach the solubility of
α-form.
In Run 2 and Run 3, α-form deposited during the experiment (Table 3.2). In
order to obtain γ -form in stability, there is an anti-solvent addition rate that does not
exceed the solubility curve of α-form. It is confirmed that it is important to control
the solution composition in the operation area where only γ -form deposits using
the ternary phase diagram and the simulation. However, under the conditions of a
constant addition rate, the batch operation time becomes long.
3.4.5.2 Method B (Gradual Change of Addition Rate)
It was understood that a crystal growth rate constant K
g becomes large with antisolvent (heptane) composition (Fig. 3.8). Using the nature of this crystallization
phenomenon, if an anti-solvent addition rate increases gradually, the batch operation
time will be shortened. Then, the endpoint of Method A and Method B (Run 4) were
compared by the simulation. The results of the solution composition trajectory are
shown in Fig. 3.9.
Under the same batch time condition, the endpoint of Method A (Run 1) is w H =
0.29 (yield 29%) and Method B (Run 4) is w H = 0.52 (yield 58%), respectively. In
this way, when Method B is used, it is expected that the yield can increase even in
the same batch operation time. From the experimental result of Run 4, γ -form was
selectively obtained in 2 h after the experiment start-up (Table 3.2).
Fig. 3.8 Anti-solvent
composition dependence
crystal growth rate constant
K g at 313 and 323 K
0
0.2
0.4
0.6
0.05
0.1
0.15
Crystal growth rate constant
K'
g [g/s]
Heptane w H [mass fraction]
313 K
323 K