

2 Direct Visualization of Crystal Formation and Growth …
41
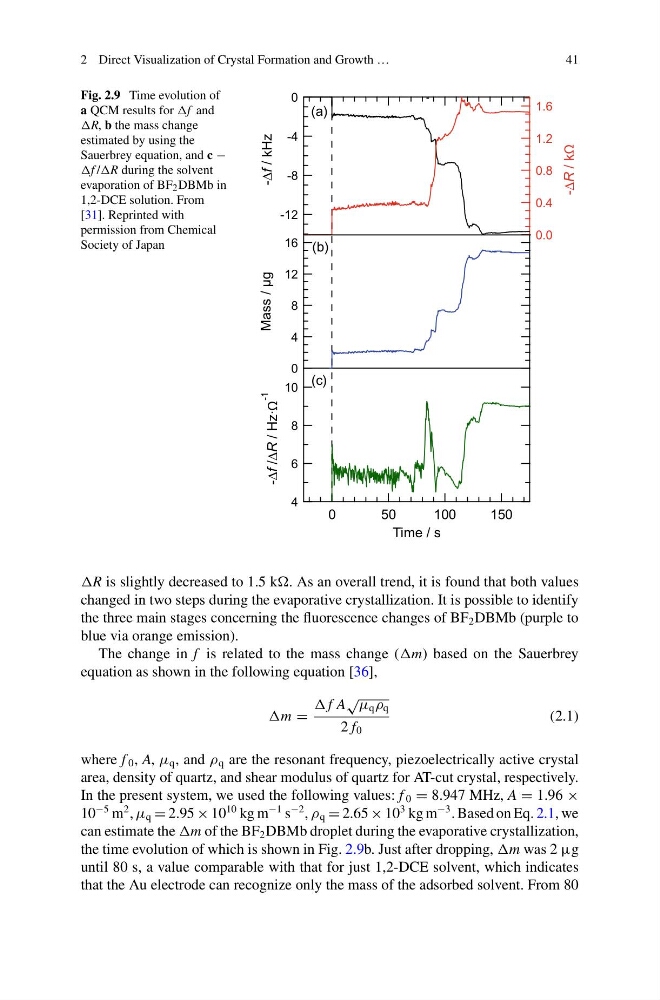
Fig. 2.9 Time evolution of
a QCM results for and
b the mass change
estimated by using the
Sauerbrey equation, and c −
/ during the solvent
evaporation of BF 2 DBMb in
1,2-DCE solution. From
[31]. Reprinted with
permission from Chemical
Society of Japan
16
12
8
4
0
Mass /
µg
150
100
50
0
Time / s
10
8
6
4
-Δf /ΔR / Hz·
-1
-12
-8
-4
0
-Δf / kHz
1.6
1.2
0.8
0.4
0.0
-ΔR
/ k
(a)
(b)
(c)
is slightly decreased to 1.5 k. As an overall trend, it is found that both values
changed in two steps during the evaporative crystallization. It is possible to identify
the three main stages concerning the fluorescence changes of BF 2 DBMb (purple to
blue via orange emission).
The change in f is related to the mass change ( based on the Sauerbrey
equation as shown in the following equation [36],
=
f A
√ μ q ρ q
2 f 0
(2.1)
where f 0 , A, μ q , and ρ q are the resonant frequency, piezoelectrically active crystal
area, density of quartz, and shear modulus of quartz for AT-cut crystal, respectively.
In the present system, we used the following values: f 0 = 8.947 MHz, A = 1.96 ×
10
−5 m
2 , μ q = 2.95 × 10
10 kg m
−1 s
−2 , ρ q = 2.65 × 10
3 kg m
−3 . Based on Eq. 2.1, we
can estimate the of the BF 2 DBMb droplet during the evaporative crystallization,
the time evolution of which is shown in Fig. 2.9b. Just after dropping, was 2 μg
until 80 s, a value comparable with that for just 1,2-DCE solvent, which indicates
that the Au electrode can recognize only the mass of the adsorbed solvent. From 80
41
Fig. 2.9 Time evolution of
a QCM results for and
b the mass change
estimated by using the
Sauerbrey equation, and c −
/ during the solvent
evaporation of BF 2 DBMb in
1,2-DCE solution. From
[31]. Reprinted with
permission from Chemical
Society of Japan
16
12
8
4
0
Mass /
µg
150
100
50
0
Time / s
10
8
6
4
-Δf /ΔR / Hz·
-1
-12
-8
-4
0
-Δf / kHz
1.6
1.2
0.8
0.4
0.0
-ΔR
/ k
(a)
(b)
(c)
is slightly decreased to 1.5 k. As an overall trend, it is found that both values
changed in two steps during the evaporative crystallization. It is possible to identify
the three main stages concerning the fluorescence changes of BF 2 DBMb (purple to
blue via orange emission).
The change in f is related to the mass change ( based on the Sauerbrey
equation as shown in the following equation [36],
=
f A
√ μ q ρ q
2 f 0
(2.1)
where f 0 , A, μ q , and ρ q are the resonant frequency, piezoelectrically active crystal
area, density of quartz, and shear modulus of quartz for AT-cut crystal, respectively.
In the present system, we used the following values: f 0 = 8.947 MHz, A = 1.96 ×
10
−5 m
2 , μ q = 2.95 × 10
10 kg m
−1 s
−2 , ρ q = 2.65 × 10
3 kg m
−3 . Based on Eq. 2.1, we
can estimate the of the BF 2 DBMb droplet during the evaporative crystallization,
the time evolution of which is shown in Fig. 2.9b. Just after dropping, was 2 μg
until 80 s, a value comparable with that for just 1,2-DCE solvent, which indicates
that the Au electrode can recognize only the mass of the adsorbed solvent. From 80