

2 Direct Visualization of Crystal Formation and Growth …
35
states were confirmed by XRD measurement. These findings indicate that molecular
forms, such as monomer (isolated state) and aggregated state, can be distinguished
by fluorescence color change.
Up to now, we have reported the evolution of the molecular assembling by fluorescence change in polymer matrix, which can provide information on the aggregation
and segregation processes. To confirm the molecular assembling of BF 2 DBMb in
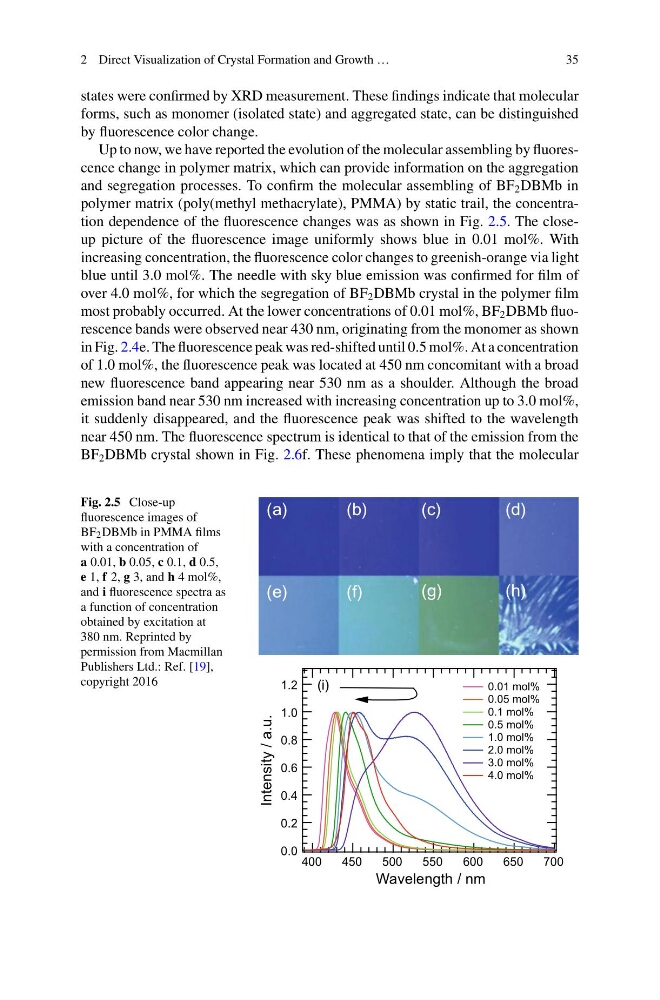
polymer matrix (poly(methyl methacrylate), PMMA) by static trail, the concentration dependence of the fluorescence changes was as shown in Fig. 2.5. The closeup picture of the fluorescence image uniformly shows blue in 0.01 mol%. With
increasing concentration, the fluorescence color changes to greenish-orange via light
blue until 3.0 mol%. The needle with sky blue emission was confirmed for film of
over 4.0 mol%, for which the segregation of BF 2 DBMb crystal in the polymer film
most probably occurred. At the lower concentrations of 0.01 mol%, BF 2 DBMb fluorescence bands were observed near 430 nm, originating from the monomer as shown
in Fig. 2.4e. The fluorescence peak was red-shifted until 0.5 mol%. At a concentration
of 1.0 mol%, the fluorescence peak was located at 450 nm concomitant with a broad
new fluorescence band appearing near 530 nm as a shoulder. Although the broad
emission band near 530 nm increased with increasing concentration up to 3.0 mol%,
it suddenly disappeared, and the fluorescence peak was shifted to the wavelength
near 450 nm. The fluorescence spectrum is identical to that of the emission from the
BF 2 DBMb crystal shown in Fig. 2.6f. These phenomena imply that the molecular
Fig. 2.5 Close-up
fluorescence images of
BF 2 DBMb in PMMA films
with a concentration of
a 0.01, b 0.05, c 0.1, d 0.5,
e 1, f 2, g 3, and h 4 mol%,
and i fluorescence spectra as
a function of concentration
obtained by excitation at
380 nm. Reprinted by
permission from Macmillan
Publishers Ltd.: Ref. [19],
copyright 2016
1.2
1.0
0.8
0.6
0.4
0.2
0.0
Intensity / a.u.
700
650
600
550
500
450
400
Wavelength / nm
0.01 mol%
0.05 mol%
0.1 mol%
0.5 mol%
1.0 mol%
2.0 mol%
3.0 mol%
4.0 mol%
(a)
(b)
(d)
(e)
(f)
(g)
(h)
(c)
(i)
35
states were confirmed by XRD measurement. These findings indicate that molecular
forms, such as monomer (isolated state) and aggregated state, can be distinguished
by fluorescence color change.
Up to now, we have reported the evolution of the molecular assembling by fluorescence change in polymer matrix, which can provide information on the aggregation
and segregation processes. To confirm the molecular assembling of BF 2 DBMb in
polymer matrix (poly(methyl methacrylate), PMMA) by static trail, the concentration dependence of the fluorescence changes was as shown in Fig. 2.5. The closeup picture of the fluorescence image uniformly shows blue in 0.01 mol%. With
increasing concentration, the fluorescence color changes to greenish-orange via light
blue until 3.0 mol%. The needle with sky blue emission was confirmed for film of
over 4.0 mol%, for which the segregation of BF 2 DBMb crystal in the polymer film
most probably occurred. At the lower concentrations of 0.01 mol%, BF 2 DBMb fluorescence bands were observed near 430 nm, originating from the monomer as shown
in Fig. 2.4e. The fluorescence peak was red-shifted until 0.5 mol%. At a concentration
of 1.0 mol%, the fluorescence peak was located at 450 nm concomitant with a broad
new fluorescence band appearing near 530 nm as a shoulder. Although the broad
emission band near 530 nm increased with increasing concentration up to 3.0 mol%,
it suddenly disappeared, and the fluorescence peak was shifted to the wavelength
near 450 nm. The fluorescence spectrum is identical to that of the emission from the
BF 2 DBMb crystal shown in Fig. 2.6f. These phenomena imply that the molecular
Fig. 2.5 Close-up
fluorescence images of
BF 2 DBMb in PMMA films
with a concentration of
a 0.01, b 0.05, c 0.1, d 0.5,
e 1, f 2, g 3, and h 4 mol%,
and i fluorescence spectra as
a function of concentration
obtained by excitation at
380 nm. Reprinted by
permission from Macmillan
Publishers Ltd.: Ref. [19],
copyright 2016
1.2
1.0
0.8
0.6
0.4
0.2
0.0
Intensity / a.u.
700
650
600
550
500
450
400
Wavelength / nm
0.01 mol%
0.05 mol%
0.1 mol%
0.5 mol%
1.0 mol%
2.0 mol%
3.0 mol%
4.0 mol%
(a)
(b)
(d)
(e)
(f)
(g)
(h)
(c)
(i)