

34
F. Ito
500 µm
1.2
1.0
0.8
0.6
0.4
0.2
0.0
Absorbance
550
500
450
400
350
300
Wavelength / nm
1.2
1.0
0.8
0.6
0.4
0.2
0.0
Intensity
/ a.u.
Absorption
Fluorescence
1.2
1.0
0.8
0.6
0.4
0.2
0.0
Intensity
/a.u.
800
700
600
500
400
Wavelength / nm
crystal
amorphous
(b)
(c)
(e)
(f)
O
O
B
F
F
(a)
500 µm
(d)
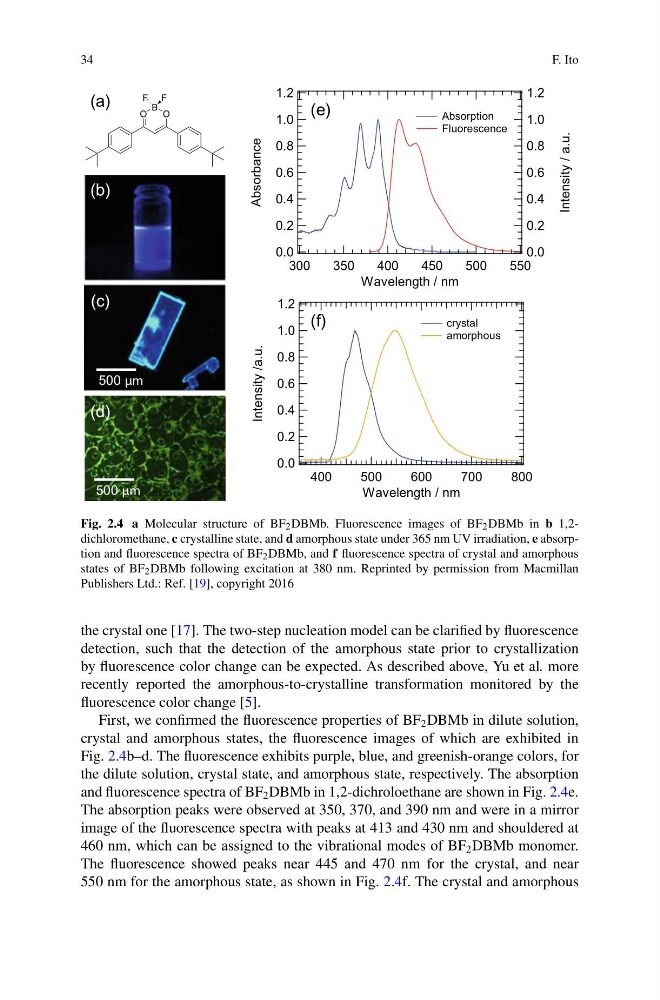
Fig. 2.4 a Molecular structure of BF 2 DBMb. Fluorescence images of BF 2 DBMb in b 1,2dichloromethane, c crystalline state, and d amorphous state under 365 nm UV irradiation, e absorption and fluorescence spectra of BF 2 DBMb, and f fluorescence spectra of crystal and amorphous
states of BF 2 DBMb following excitation at 380 nm. Reprinted by permission from Macmillan
Publishers Ltd.: Ref. [19], copyright 2016
the crystal one [17]. The two-step nucleation model can be clarified by fluorescence
detection, such that the detection of the amorphous state prior to crystallization
by fluorescence color change can be expected. As described above, Yu et al. more
recently reported the amorphous-to-crystalline transformation monitored by the
fluorescence color change [5].
First, we confirmed the fluorescence properties of BF 2 DBMb in dilute solution,
crystal and amorphous states, the fluorescence images of which are exhibited in
Fig. 2.4b–d. The fluorescence exhibits purple, blue, and greenish-orange colors, for
the dilute solution, crystal state, and amorphous state, respectively. The absorption
and fluorescence spectra of BF 2 DBMb in 1,2-dichroloethane are shown in Fig. 2.4e.
The absorption peaks were observed at 350, 370, and 390 nm and were in a mirror
image of the fluorescence spectra with peaks at 413 and 430 nm and shouldered at
460 nm, which can be assigned to the vibrational modes of BF 2 DBMb monomer.
The fluorescence showed peaks near 445 and 470 nm for the crystal, and near
550 nm for the amorphous state, as shown in Fig. 2.4f. The crystal and amorphous
F. Ito
500 µm
1.2
1.0
0.8
0.6
0.4
0.2
0.0
Absorbance
550
500
450
400
350
300
Wavelength / nm
1.2
1.0
0.8
0.6
0.4
0.2
0.0
Intensity
/ a.u.
Absorption
Fluorescence
1.2
1.0
0.8
0.6
0.4
0.2
0.0
Intensity
/a.u.
800
700
600
500
400
Wavelength / nm
crystal
amorphous
(b)
(c)
(e)
(f)
O
O
B
F
F
(a)
500 µm
(d)
Fig. 2.4 a Molecular structure of BF 2 DBMb. Fluorescence images of BF 2 DBMb in b 1,2dichloromethane, c crystalline state, and d amorphous state under 365 nm UV irradiation, e absorption and fluorescence spectra of BF 2 DBMb, and f fluorescence spectra of crystal and amorphous
states of BF 2 DBMb following excitation at 380 nm. Reprinted by permission from Macmillan
Publishers Ltd.: Ref. [19], copyright 2016
the crystal one [17]. The two-step nucleation model can be clarified by fluorescence
detection, such that the detection of the amorphous state prior to crystallization
by fluorescence color change can be expected. As described above, Yu et al. more
recently reported the amorphous-to-crystalline transformation monitored by the
fluorescence color change [5].
First, we confirmed the fluorescence properties of BF 2 DBMb in dilute solution,
crystal and amorphous states, the fluorescence images of which are exhibited in
Fig. 2.4b–d. The fluorescence exhibits purple, blue, and greenish-orange colors, for
the dilute solution, crystal state, and amorphous state, respectively. The absorption
and fluorescence spectra of BF 2 DBMb in 1,2-dichroloethane are shown in Fig. 2.4e.
The absorption peaks were observed at 350, 370, and 390 nm and were in a mirror
image of the fluorescence spectra with peaks at 413 and 430 nm and shouldered at
460 nm, which can be assigned to the vibrational modes of BF 2 DBMb monomer.
The fluorescence showed peaks near 445 and 470 nm for the crystal, and near
550 nm for the amorphous state, as shown in Fig. 2.4f. The crystal and amorphous