

352
H. Katagiri
Table 17.1 Optical properties of terazulene isomers TAz1, TAz2, TAz3, and TAz4 in their film
forms
Compound
λ onset (nm)
E a
g-abs (eV)
HOMO b (eV)
LUMO c (eV)
TAz1
757
1.63
−5.56
−3.93
TAz2
764
1.62
−5.45
−3.83
TAz3
785
1.57
−5.47
−3.90
TAz4
795
1.56
−5.49
−3.93
a Determined from the absorption edge
b Determined by photoemission yield spectroscopy (PYS)
c LUMO energies calculated by adding the optical band gap (Eg-abs) to the HOMO energy
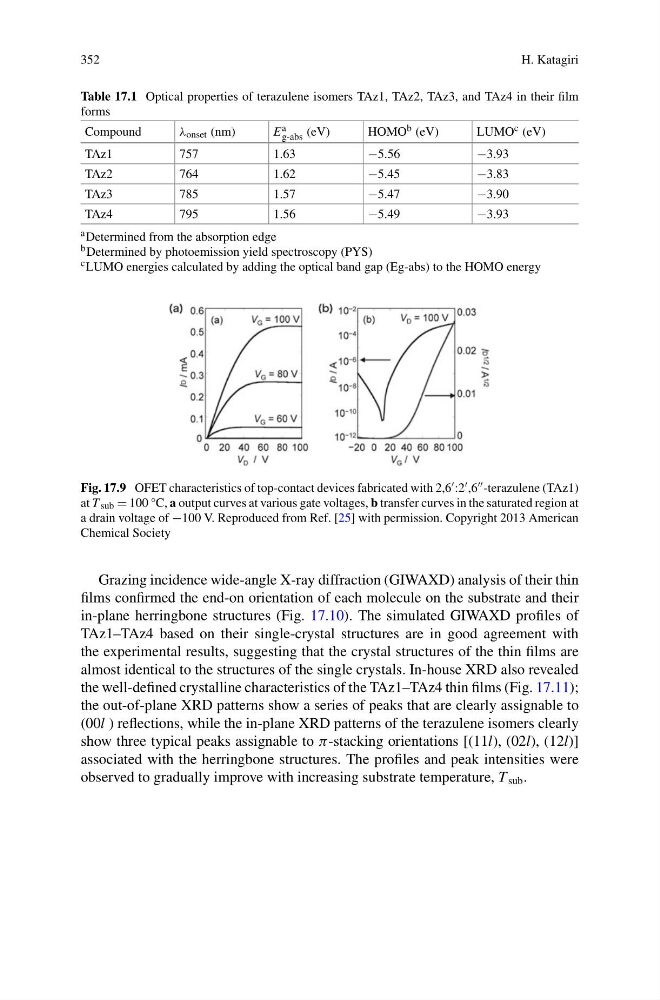
Fig. 17.9 OFET characteristics of top-contact devices fabricated with 2,6 :2 ,6 -terazulene (TAz1)
at T sub = 100 °C, a output curves at various gate voltages, b transfer curves in the saturated region at
a drain voltage of −100 V. Reproduced from Ref. [25] with permission. Copyright 2013 American
Chemical Society
Grazing incidence wide-angle X-ray diffraction (GIWAXD) analysis of their thin
films confirmed the end-on orientation of each molecule on the substrate and their
in-plane herringbone structures (Fig. 17.10). The simulated GIWAXD profiles of
TAz1–TAz4 based on their single-crystal structures are in good agreement with
the experimental results, suggesting that the crystal structures of the thin films are
almost identical to the structures of the single crystals. In-house XRD also revealed
the well-defined crystalline characteristics of the TAz1–TAz4 thin films (Fig. 17.11);
the out-of-plane XRD patterns show a series of peaks that are clearly assignable to
(00l ) reflections, while the in-plane XRD patterns of the terazulene isomers clearly
show three typical peaks assignable to π-stacking orientations [(11l), (02l), (12l)]
associated with the herringbone structures. The profiles and peak intensities were
observed to gradually improve with increasing substrate temperature, T sub .
H. Katagiri
Table 17.1 Optical properties of terazulene isomers TAz1, TAz2, TAz3, and TAz4 in their film
forms
Compound
λ onset (nm)
E a
g-abs (eV)
HOMO b (eV)
LUMO c (eV)
TAz1
757
1.63
−5.56
−3.93
TAz2
764
1.62
−5.45
−3.83
TAz3
785
1.57
−5.47
−3.90
TAz4
795
1.56
−5.49
−3.93
a Determined from the absorption edge
b Determined by photoemission yield spectroscopy (PYS)
c LUMO energies calculated by adding the optical band gap (Eg-abs) to the HOMO energy
Fig. 17.9 OFET characteristics of top-contact devices fabricated with 2,6 :2 ,6 -terazulene (TAz1)
at T sub = 100 °C, a output curves at various gate voltages, b transfer curves in the saturated region at
a drain voltage of −100 V. Reproduced from Ref. [25] with permission. Copyright 2013 American
Chemical Society
Grazing incidence wide-angle X-ray diffraction (GIWAXD) analysis of their thin
films confirmed the end-on orientation of each molecule on the substrate and their
in-plane herringbone structures (Fig. 17.10). The simulated GIWAXD profiles of
TAz1–TAz4 based on their single-crystal structures are in good agreement with
the experimental results, suggesting that the crystal structures of the thin films are
almost identical to the structures of the single crystals. In-house XRD also revealed
the well-defined crystalline characteristics of the TAz1–TAz4 thin films (Fig. 17.11);
the out-of-plane XRD patterns show a series of peaks that are clearly assignable to
(00l ) reflections, while the in-plane XRD patterns of the terazulene isomers clearly
show three typical peaks assignable to π-stacking orientations [(11l), (02l), (12l)]
associated with the herringbone structures. The profiles and peak intensities were
observed to gradually improve with increasing substrate temperature, T sub .