

286
T. Mutai
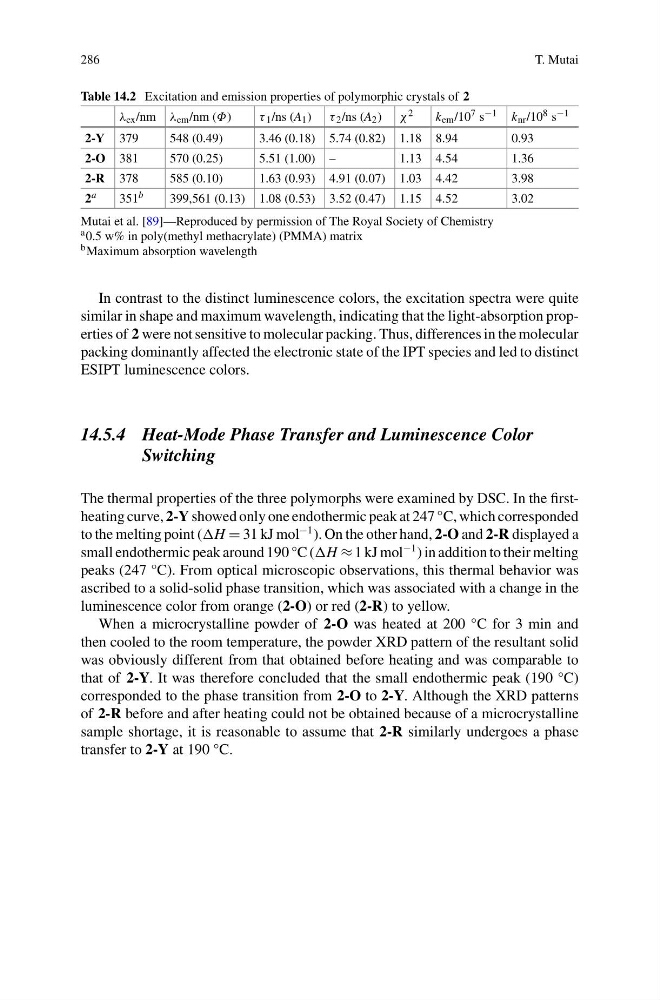
Table 14.2 Excitation and emission properties of polymorphic crystals of 2
λ ex /nm λ em /nm (Φ)
τ 1 /ns (A 1 ) τ 2 /ns (A 2 ) χ 2
k em /10 7 s −1 k nr /10 8 s −1
2-Y 379
548 (0.49)
3.46 (0.18) 5.74 (0.82) 1.18 8.94
0.93
2-O 381
570 (0.25)
5.51 (1.00) –
1.13 4.54
1.36
2-R 378
585 (0.10)
1.63 (0.93) 4.91 (0.07) 1.03 4.42
3.98
2 a
351 b
399,561 (0.13) 1.08 (0.53) 3.52 (0.47) 1.15 4.52
3.02
Mutai et al. [89]—Reproduced by permission of The Royal Society of Chemistry
a 0.5 w% in poly(methyl methacrylate) (PMMA) matrix
b Maximum absorption wavelength
In contrast to the distinct luminescence colors, the excitation spectra were quite
similar in shape and maximum wavelength, indicating that the light-absorption properties of 2 were not sensitive to molecular packing. Thus, differences in the molecular
packing dominantly affected the electronic state of the IPT species and led to distinct
ESIPT luminescence colors.
14.5.4 Heat-Mode Phase Transfer and Luminescence Color
Switching
The thermal properties of the three polymorphs were examined by DSC. In the firstheating curve, 2-Y showed only one endothermic peak at 247 °C, which corresponded
to the melting point (H = 31 kJ mol
−1 ). On the other hand, 2-O and 2-R displayed a
small endothermic peak around 190 °C (H ≈ 1 kJ mol
−1 ) in addition to their melting
peaks (247 °C). From optical microscopic observations, this thermal behavior was
ascribed to a solid-solid phase transition, which was associated with a change in the
luminescence color from orange (2-O) or red (2-R) to yellow.
When a microcrystalline powder of 2-O was heated at 200 °C for 3 min and
then cooled to the room temperature, the powder XRD pattern of the resultant solid
was obviously different from that obtained before heating and was comparable to
that of 2-Y. It was therefore concluded that the small endothermic peak (190 °C)
corresponded to the phase transition from 2-O to 2-Y. Although the XRD patterns
of 2-R before and after heating could not be obtained because of a microcrystalline
sample shortage, it is reasonable to assume that 2-R similarly undergoes a phase
transfer to 2-Y at 190 °C.
T. Mutai
Table 14.2 Excitation and emission properties of polymorphic crystals of 2
λ ex /nm λ em /nm (Φ)
τ 1 /ns (A 1 ) τ 2 /ns (A 2 ) χ 2
k em /10 7 s −1 k nr /10 8 s −1
2-Y 379
548 (0.49)
3.46 (0.18) 5.74 (0.82) 1.18 8.94
0.93
2-O 381
570 (0.25)
5.51 (1.00) –
1.13 4.54
1.36
2-R 378
585 (0.10)
1.63 (0.93) 4.91 (0.07) 1.03 4.42
3.98
2 a
351 b
399,561 (0.13) 1.08 (0.53) 3.52 (0.47) 1.15 4.52
3.02
Mutai et al. [89]—Reproduced by permission of The Royal Society of Chemistry
a 0.5 w% in poly(methyl methacrylate) (PMMA) matrix
b Maximum absorption wavelength
In contrast to the distinct luminescence colors, the excitation spectra were quite
similar in shape and maximum wavelength, indicating that the light-absorption properties of 2 were not sensitive to molecular packing. Thus, differences in the molecular
packing dominantly affected the electronic state of the IPT species and led to distinct
ESIPT luminescence colors.
14.5.4 Heat-Mode Phase Transfer and Luminescence Color
Switching
The thermal properties of the three polymorphs were examined by DSC. In the firstheating curve, 2-Y showed only one endothermic peak at 247 °C, which corresponded
to the melting point (H = 31 kJ mol
−1 ). On the other hand, 2-O and 2-R displayed a
small endothermic peak around 190 °C (H ≈ 1 kJ mol
−1 ) in addition to their melting
peaks (247 °C). From optical microscopic observations, this thermal behavior was
ascribed to a solid-solid phase transition, which was associated with a change in the
luminescence color from orange (2-O) or red (2-R) to yellow.
When a microcrystalline powder of 2-O was heated at 200 °C for 3 min and
then cooled to the room temperature, the powder XRD pattern of the resultant solid
was obviously different from that obtained before heating and was comparable to
that of 2-Y. It was therefore concluded that the small endothermic peak (190 °C)
corresponded to the phase transition from 2-O to 2-Y. Although the XRD patterns
of 2-R before and after heating could not be obtained because of a microcrystalline
sample shortage, it is reasonable to assume that 2-R similarly undergoes a phase
transfer to 2-Y at 190 °C.