

1 X-Ray Birefringence Imaging (XBI): A New Technique …
21
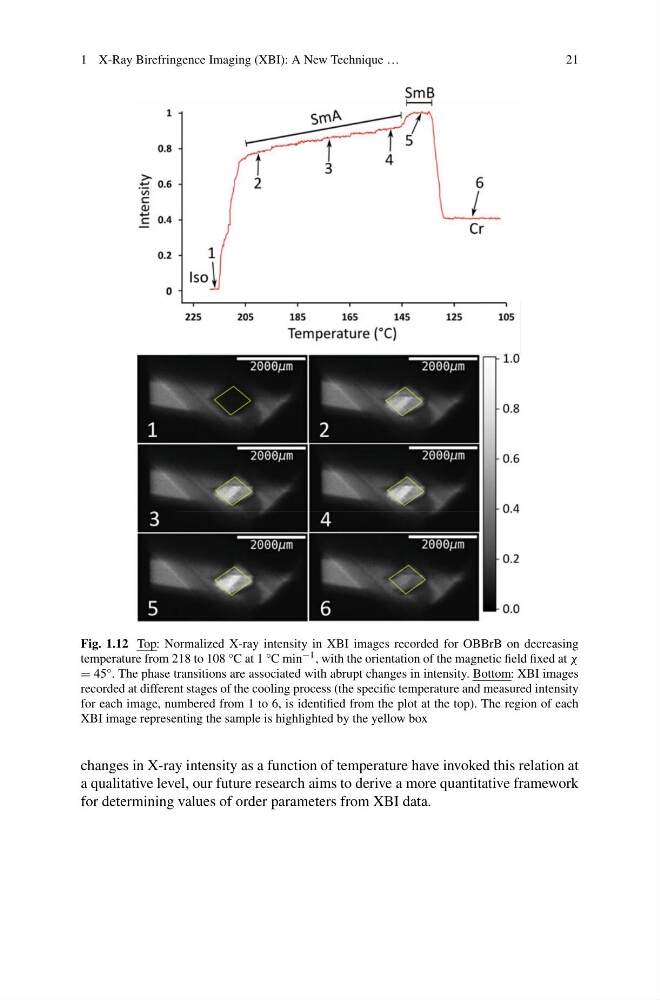
Fig. 1.12 Top: Normalized X-ray intensity in XBI images recorded for OBBrB on decreasing
temperature from 218 to 108 °C at 1 °C min −1 , with the orientation of the magnetic field fixed at χ
= 45°. The phase transitions are associated with abrupt changes in intensity. Bottom: XBI images
recorded at different stages of the cooling process (the specific temperature and measured intensity
for each image, numbered from 1 to 6, is identified from the plot at the top). The region of each
XBI image representing the sample is highlighted by the yellow box
changes in X-ray intensity as a function of temperature have invoked this relation at
a qualitative level, our future research aims to derive a more quantitative framework
for determining values of order parameters from XBI data.
21
Fig. 1.12 Top: Normalized X-ray intensity in XBI images recorded for OBBrB on decreasing
temperature from 218 to 108 °C at 1 °C min −1 , with the orientation of the magnetic field fixed at χ
= 45°. The phase transitions are associated with abrupt changes in intensity. Bottom: XBI images
recorded at different stages of the cooling process (the specific temperature and measured intensity
for each image, numbered from 1 to 6, is identified from the plot at the top). The region of each
XBI image representing the sample is highlighted by the yellow box
changes in X-ray intensity as a function of temperature have invoked this relation at
a qualitative level, our future research aims to derive a more quantitative framework
for determining values of order parameters from XBI data.