

1 X-Ray Birefringence Imaging (XBI): A New Technique …
19
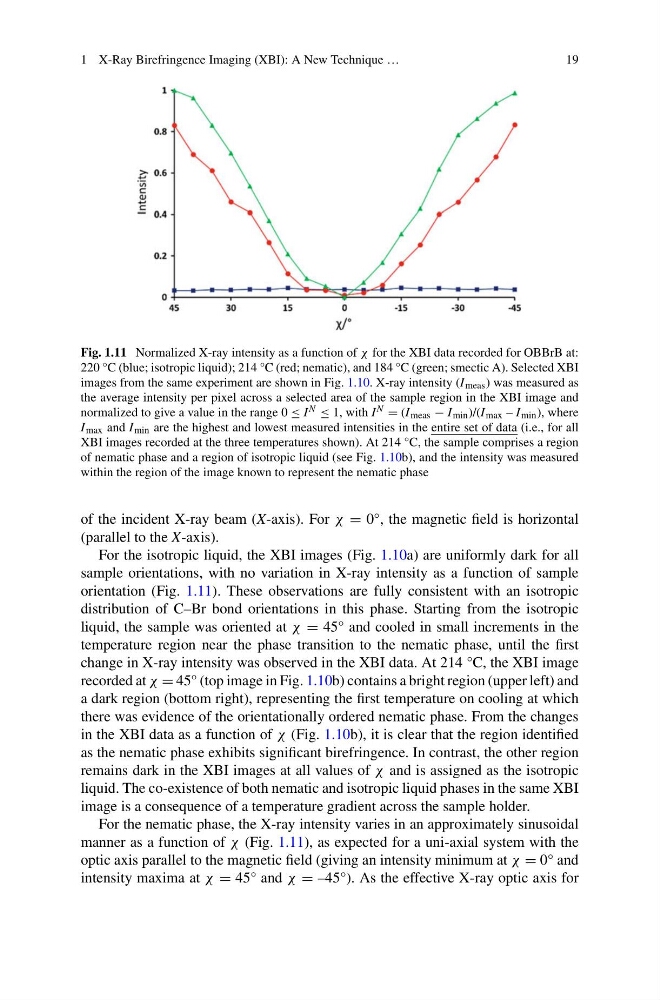
Fig. 1.11 Normalized X-ray intensity as a function of χ for the XBI data recorded for OBBrB at:
220 °C (blue; isotropic liquid); 214 °C (red; nematic), and 184 °C (green; smectic A). Selected XBI
images from the same experiment are shown in Fig. 1.10. X-ray intensity (I meas ) was measured as
the average intensity per pixel across a selected area of the sample region in the XBI image and
normalized to give a value in the range 0 ≤ I N ≤ 1, with I N = (I meas − I min )/(I max – I min ), where
I max and I min are the highest and lowest measured intensities in the entire set of data (i.e., for all
XBI images recorded at the three temperatures shown). At 214 °C, the sample comprises a region
of nematic phase and a region of isotropic liquid (see Fig. 1.10b), and the intensity was measured
within the region of the image known to represent the nematic phase
of the incident X-ray beam (X-axis). For χ = 0°, the magnetic field is horizontal
(parallel to the X-axis).
For the isotropic liquid, the XBI images (Fig. 1.10a) are uniformly dark for all
sample orientations, with no variation in X-ray intensity as a function of sample
orientation (Fig. 1.11). These observations are fully consistent with an isotropic
distribution of C–Br bond orientations in this phase. Starting from the isotropic
liquid, the sample was oriented at χ = 45° and cooled in small increments in the
temperature region near the phase transition to the nematic phase, until the first
change in X-ray intensity was observed in the XBI data. At 214 °C, the XBI image
recorded at χ = 45° (top image in Fig. 1.10b) contains a bright region (upper left) and
a dark region (bottom right), representing the first temperature on cooling at which
there was evidence of the orientationally ordered nematic phase. From the changes
in the XBI data as a function of χ (Fig. 1.10b), it is clear that the region identified
as the nematic phase exhibits significant birefringence. In contrast, the other region
remains dark in the XBI images at all values of χ and is assigned as the isotropic
liquid. The co-existence of both nematic and isotropic liquid phases in the same XBI
image is a consequence of a temperature gradient across the sample holder.
For the nematic phase, the X-ray intensity varies in an approximately sinusoidal
manner as a function of χ (Fig. 1.11), as expected for a uni-axial system with the
optic axis parallel to the magnetic field (giving an intensity minimum at χ = 0° and
intensity maxima at χ = 45° and χ = –45°). As the effective X-ray optic axis for
19
Fig. 1.11 Normalized X-ray intensity as a function of χ for the XBI data recorded for OBBrB at:
220 °C (blue; isotropic liquid); 214 °C (red; nematic), and 184 °C (green; smectic A). Selected XBI
images from the same experiment are shown in Fig. 1.10. X-ray intensity (I meas ) was measured as
the average intensity per pixel across a selected area of the sample region in the XBI image and
normalized to give a value in the range 0 ≤ I N ≤ 1, with I N = (I meas − I min )/(I max – I min ), where
I max and I min are the highest and lowest measured intensities in the entire set of data (i.e., for all
XBI images recorded at the three temperatures shown). At 214 °C, the sample comprises a region
of nematic phase and a region of isotropic liquid (see Fig. 1.10b), and the intensity was measured
within the region of the image known to represent the nematic phase
of the incident X-ray beam (X-axis). For χ = 0°, the magnetic field is horizontal
(parallel to the X-axis).
For the isotropic liquid, the XBI images (Fig. 1.10a) are uniformly dark for all
sample orientations, with no variation in X-ray intensity as a function of sample
orientation (Fig. 1.11). These observations are fully consistent with an isotropic
distribution of C–Br bond orientations in this phase. Starting from the isotropic
liquid, the sample was oriented at χ = 45° and cooled in small increments in the
temperature region near the phase transition to the nematic phase, until the first
change in X-ray intensity was observed in the XBI data. At 214 °C, the XBI image
recorded at χ = 45° (top image in Fig. 1.10b) contains a bright region (upper left) and
a dark region (bottom right), representing the first temperature on cooling at which
there was evidence of the orientationally ordered nematic phase. From the changes
in the XBI data as a function of χ (Fig. 1.10b), it is clear that the region identified
as the nematic phase exhibits significant birefringence. In contrast, the other region
remains dark in the XBI images at all values of χ and is assigned as the isotropic
liquid. The co-existence of both nematic and isotropic liquid phases in the same XBI
image is a consequence of a temperature gradient across the sample holder.
For the nematic phase, the X-ray intensity varies in an approximately sinusoidal
manner as a function of χ (Fig. 1.11), as expected for a uni-axial system with the
optic axis parallel to the magnetic field (giving an intensity minimum at χ = 0° and
intensity maxima at χ = 45° and χ = –45°). As the effective X-ray optic axis for