

6 Managing Thermal History to Stabilize/Destabilize …
97
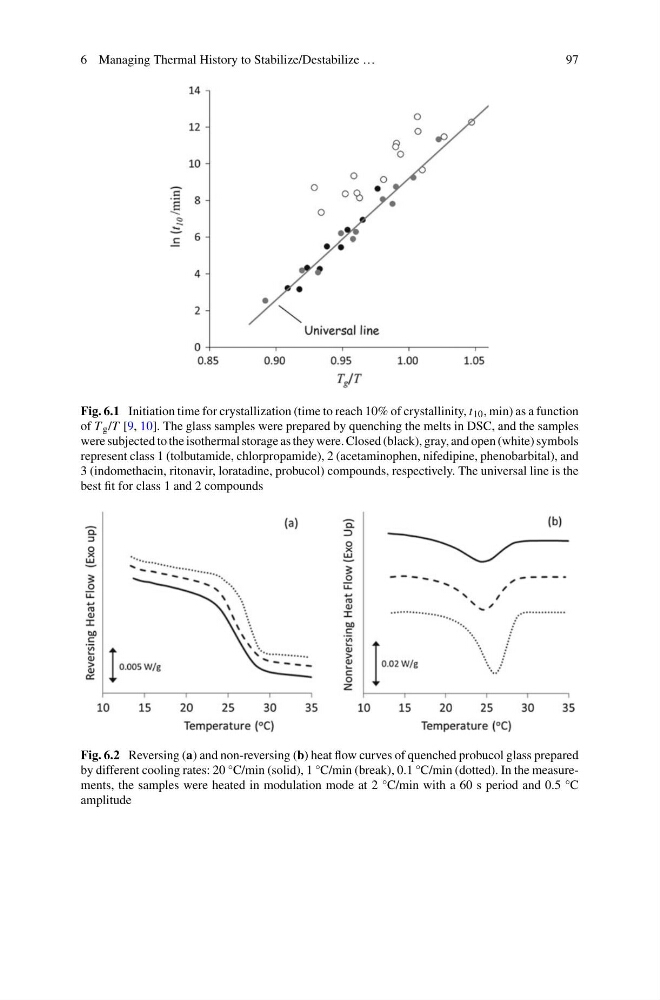
Fig. 6.1 Initiation time for crystallization (time to reach 10% of crystallinity, t 10 , min) as a function
of T g /T [9, 10]. The glass samples were prepared by quenching the melts in DSC, and the samples
were subjected to the isothermal storage as they were. Closed (black), gray, and open (white) symbols
represent class 1 (tolbutamide, chlorpropamide), 2 (acetaminophen, nifedipine, phenobarbital), and
3 (indomethacin, ritonavir, loratadine, probucol) compounds, respectively. The universal line is the
best fit for class 1 and 2 compounds
Fig. 6.2 Reversing (a) and non-reversing (b) heat flow curves of quenched probucol glass prepared
by different cooling rates: 20 °C/min (solid), 1 °C/min (break), 0.1 °C/min (dotted). In the measurements, the samples were heated in modulation mode at 2 °C/min with a 60 s period and 0.5 °C
amplitude
97
Fig. 6.1 Initiation time for crystallization (time to reach 10% of crystallinity, t 10 , min) as a function
of T g /T [9, 10]. The glass samples were prepared by quenching the melts in DSC, and the samples
were subjected to the isothermal storage as they were. Closed (black), gray, and open (white) symbols
represent class 1 (tolbutamide, chlorpropamide), 2 (acetaminophen, nifedipine, phenobarbital), and
3 (indomethacin, ritonavir, loratadine, probucol) compounds, respectively. The universal line is the
best fit for class 1 and 2 compounds
Fig. 6.2 Reversing (a) and non-reversing (b) heat flow curves of quenched probucol glass prepared
by different cooling rates: 20 °C/min (solid), 1 °C/min (break), 0.1 °C/min (dotted). In the measurements, the samples were heated in modulation mode at 2 °C/min with a 60 s period and 0.5 °C
amplitude