

22.3.5 Northern Alboran Sea Socioeconomic Evolution
The evolution of the labor productivity depicts an increasing trend due to long-term
substitution of capital for labor, thus increasing from 4 T/fisherman (1941) to 7.9 T/
fisherman (1976) with the expansion of the trawl and purse seine fleets, lessening to
7 T/fisherman in 2016 (i.e., a 73% increase from 1976—Fig. 22.4). The picture
changes when considering monetary units as the ratio €/fisherman has increased
during the whole period from 6000 €/fisherman (1941) to 22,590 €/fisherman (1976)
and 22.650 €/fishermen (2018—278% increase from 1941).
Fishermen’s wage is smaller than those of other economic sectors located in
coastal areas considering that fishermen’s wage represents a 50% share of the gross
value added (GVA) net of social security contributions paid for by the ship owner.
Note also that the GVA level is small compared to the one attained in other economic
activities of the same risk level. The latter explains the significant reduction of the
fleet in the Northern Alboran Sea during the last decades turning fishing industry in
the area into a secondary testimonial activity.
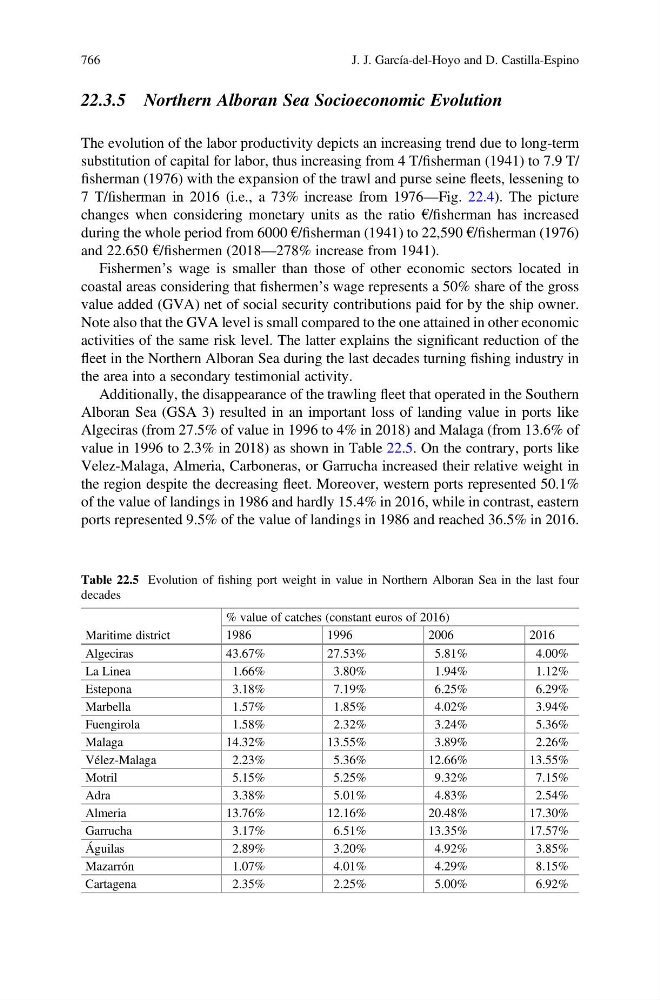
Additionally, the disappearance of the trawling fleet that operated in the Southern
Alboran Sea (GSA 3) resulted in an important loss of landing value in ports like
Algeciras (from 27.5% of value in 1996 to 4% in 2018) and Malaga (from 13.6% of
value in 1996 to 2.3% in 2018) as shown in Table 22.5. On the contrary, ports like
Velez-Malaga, Almeria, Carboneras, or Garrucha increased their relative weight in
the region despite the decreasing fleet. Moreover, western ports represented 50.1%
of the value of landings in 1986 and hardly 15.4% in 2016, while in contrast, eastern
ports represented 9.5% of the value of landings in 1986 and reached 36.5% in 2016.
Table 22.5 Evolution of fishing port weight in value in Northern Alboran Sea in the last four
decades
Maritime district
% value of catches (constant euros of 2016)
1986
1996
2006
2016
Algeciras
43.67%
27.53%
5.81%
4.00%
La Linea
1.66%
3.80%
1.94%
1.12%
Estepona
3.18%
7.19%
6.25%
6.29%
Marbella
1.57%
1.85%
4.02%
3.94%
Fuengirola
1.58%
2.32%
3.24%
5.36%
Malaga
14.32%
13.55%
3.89%
2.26%
Vélez-Malaga
2.23%
5.36%
12.66%
13.55%
Motril
5.15%
5.25%
9.32%
7.15%
Adra
3.38%
5.01%
4.83%
2.54%
Almeria
13.76%
12.16%
20.48%
17.30%
Garrucha
3.17%
6.51%
13.35%
17.57%
Águilas
2.89%
3.20%
4.92%
3.85%
Mazarrón
1.07%
4.01%
4.29%
8.15%
Cartagena
2.35%
2.25%
5.00%
6.92%
766
J. J. García-del-Hoyo and D. Castilla-Espino