

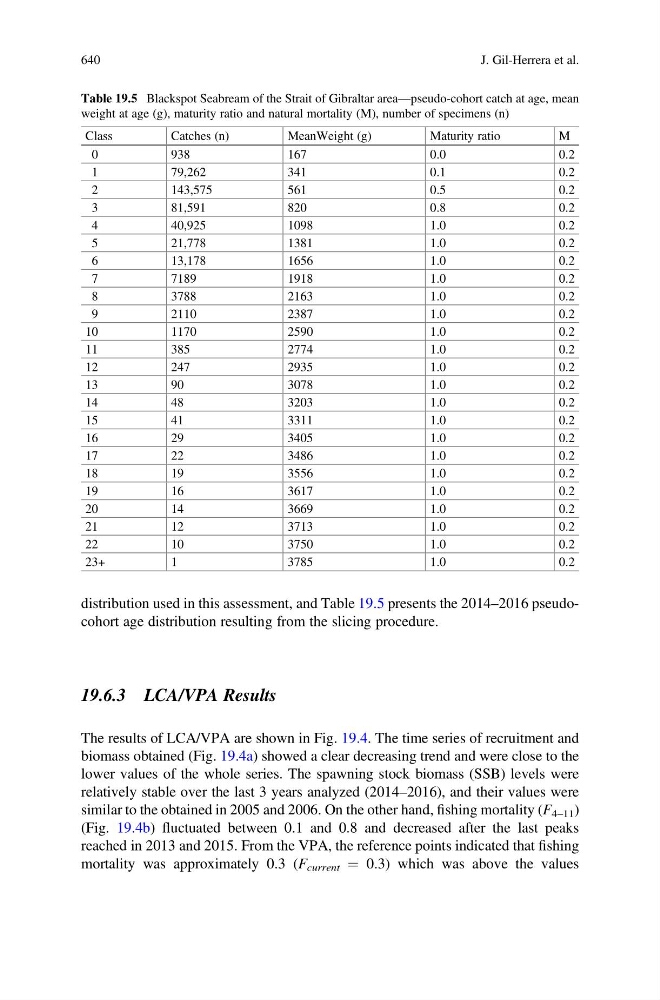
distribution used in this assessment, and Table 19.5 presents the 2014–2016 pseudocohort age distribution resulting from the slicing procedure.
19.6.3 LCA/VPA Results
The results of LCA/VPA are shown in Fig. 19.4. The time series of recruitment and
biomass obtained (Fig. 19.4a) showed a clear decreasing trend and were close to the
lower values of the whole series. The spawning stock biomass (SSB) levels were
relatively stable over the last 3 years analyzed (2014–2016), and their values were
similar to the obtained in 2005 and 2006. On the other hand, fishing mortality (F 4–11 )
(Fig. 19.4b) fluctuated between 0.1 and 0.8 and decreased after the last peaks
reached in 2013 and 2015. From the VPA, the reference points indicated that fishing
mortality was approximately 0.3 (F current ¼ 0.3) which was above the values
Table 19.5 Blackspot Seabream of the Strait of Gibraltar area—pseudo-cohort catch at age, mean
weight at age (g), maturity ratio and natural mortality (M), number of specimens (n)
Class
Catches (n)
MeanWeight (g)
Maturity ratio
M
0
938
167
0.0
0.2
1
79,262
341
0.1
0.2
2
143,575
561
0.5
0.2
3
81,591
820
0.8
0.2
4
40,925
1098
1.0
0.2
5
21,778
1381
1.0
0.2
6
13,178
1656
1.0
0.2
7
7189
1918
1.0
0.2
8
3788
2163
1.0
0.2
9
2110
2387
1.0
0.2
10
1170
2590
1.0
0.2
11
385
2774
1.0
0.2
12
247
2935
1.0
0.2
13
90
3078
1.0
0.2
14
48
3203
1.0
0.2
15
41
3311
1.0
0.2
16
29
3405
1.0
0.2
17
22
3486
1.0
0.2
18
19
3556
1.0
0.2
19
16
3617
1.0
0.2
20
14
3669
1.0
0.2
21
12
3713
1.0
0.2
22
10
3750
1.0
0.2
23+
1
3785
1.0
0.2
640
J. Gil-Herrera et al.