

test different management strategies. Particularly, these approaches are very useful
when historical information on recruitment is limited.
On the other hand, the combination of length/age data over years provides the
estimation of reference points for management purposes which also can be extended
to analyze the contribution of a fixed number of individuals to the spawning
component of population. This way, from the VPA outputs, a spawning stock
biomass per recruit analysis and the yield per recruit analyses were estimated as
the biological reference points (F MAX and F 0.1 ).
19.6.2 LCA/VPA Input Data and Parameters
Before the analysis a smoothing process of the available data (harmonization) was
carried out. Later, in order to check the stability of parameters, LCA-VPA backward
test was applied for every 2 years separately. Finally, a 2014–2016 pseudo-cohort
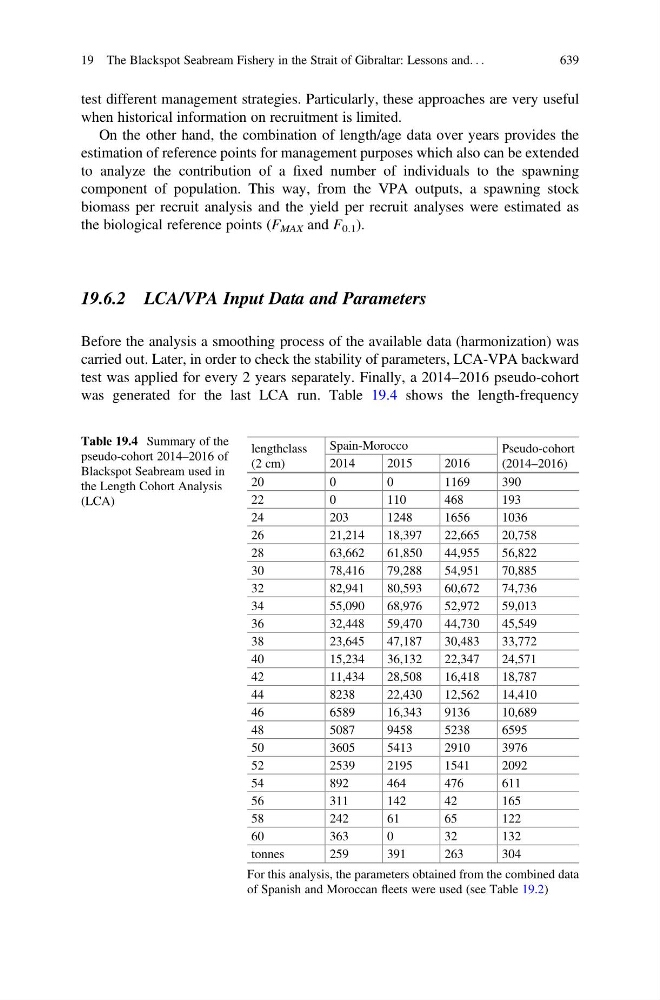
was generated for the last LCA run. Table 19.4 shows the length-frequency
Table 19.4 Summary of the
pseudo-cohort 2014–2016 of
Blackspot Seabream used in
the Length Cohort Analysis
(LCA)
lengthclass
(2 cm)
Spain-Morocco
Pseudo-cohort
(2014–2016)
2014
2015
2016
20
0
0
1169
390
22
0
110
468
193
24
203
1248
1656
1036
26
21,214
18,397
22,665
20,758
28
63,662
61,850
44,955
56,822
30
78,416
79,288
54,951
70,885
32
82,941
80,593
60,672
74,736
34
55,090
68,976
52,972
59,013
36
32,448
59,470
44,730
45,549
38
23,645
47,187
30,483
33,772
40
15,234
36,132
22,347
24,571
42
11,434
28,508
16,418
18,787
44
8238
22,430
12,562
14,410
46
6589
16,343
9136
10,689
48
5087
9458
5238
6595
50
3605
5413
2910
3976
52
2539
2195
1541
2092
54
892
464
476
611
56
311
142
42
165
58
242
61
65
122
60
363
0
32
132
tonnes
259
391
263
304
For this analysis, the parameters obtained from the combined data
of Spanish and Moroccan fleets were used (see Table 19.2)
19 The Blackspot Seabream Fishery in the Strait of Gibraltar: Lessons and. . .
639