

2006), a field-based experiment was set to verify the consequences of enhanced
larval growth in the survival of the Alboran Sea sardine and anchovy.
A field test experiment verified this hypothesis on mortality of sardine larvae. A
surviving cohort of sardine larvae from its original population was analyzed by
backtracking growth curves and compared with the original cohort sampled 2 weeks
earlier in the same nursery site (García et al. 2007). Sardine juveniles sampled and
aged on a monthly basis followed postlarval growing cohorts to their juvenile stages
also indicated that surviving juveniles showed enhanced growth rates (Alemany
et al. 2006).
In conclusion, larval survival of both species is clearly linked to faster growth
rates and better nutritional conditions. Nevertheless, the Alboran Sea sardine can
show two differentiated growth strategies, favoring growth in length or alternatively
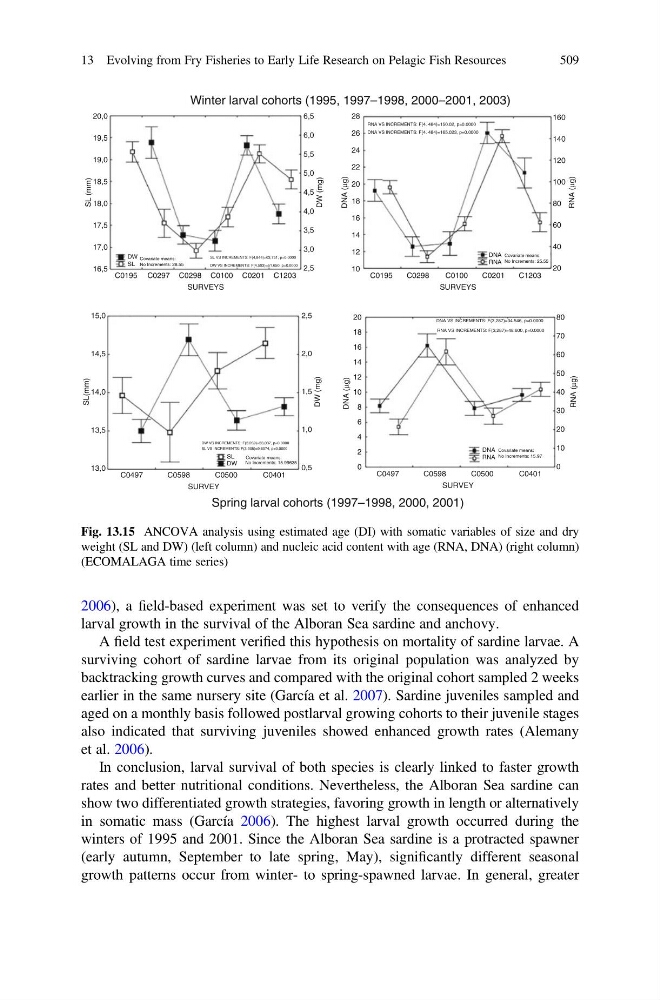
in somatic mass (García 2006). The highest larval growth occurred during the
winters of 1995 and 2001. Since the Alboran Sea sardine is a protracted spawner
(early autumn, September to late spring, May), significantly different seasonal
growth patterns occur from winter- to spring-spawned larvae. In general, greater
20,0
6,5
Winter larval cohorts (1995, 1997–1998, 2000–2001, 2003)
Spring larval cohorts (1997–1998, 2000, 2001)
6,0
5,5
5,0
4,5
4,0
3,5
3,0
2,5
19,5
19,0
18,5
18,0
SL (mm)
DW (mg)
17,5
17,0
16,5
C0195 C0297 C0298 C0100
SURVEYS
C0201 C1203
28
RNA VS INCREMENTS: F(4. 484)=150.02, p=0.0000
DNA VS INCREMENTS: F(4. 484)=165.023, p=0.0000
RNA VS INCREMENTS: F(3,287)=48.600, p=0.0000
DNA VS INCREMENTS: F(3,287)=34.546, p=0.0000
SL VS INCREMENTS: F(4,844)=63,751, p=0.0000
DW VS INCREMENTS: F(4,593)=51,650, p=0.0000
SL VS INCREMENTS: F(3.305)=9,6074, p=0.0000
DW VS INCREMENTS: F(3.269)=33,037, p=0.0000
DNA Covariate means:
No Increments: 25.55
RNA
DNA Covariate means:
No Increments: 15.97
RNA
DW Covariate means:
No Increments: 28.55
SL
DW
Covariate means:
No Increments: 15.99635
SL
160
140
120
100
80
60
40
20
26
24
22
20
18
DNA (µg)
RNA (µg)
16
14
12
10
C0195
C0298
C0100
SURVEYS
C0201
C1203
15,0
2,5
2,0
1,5
1,0
0,5
14,5
14,0
SL(mm)
DW (mg)
13,5
13,0
C0497
C0598
C0500
SURVEY
C0401
C0497
C0598
C0500
C0401
20
80
70
60
50
30
40
20
10
0
18
16
14
12
10
8
DNA (µg)
RNA (µg)
6
4
2
0
SURVEY
Fig. 13.15 ANCOVA analysis using estimated age (DI) with somatic variables of size and dry
weight (SL and DW) (left column) and nucleic acid content with age (RNA, DNA) (right column)
(ECOMALAGA time series)
13 Evolving from Fry Fisheries to Early Life Research on Pelagic Fish Resources
509
larval growth in the survival of the Alboran Sea sardine and anchovy.
A field test experiment verified this hypothesis on mortality of sardine larvae. A
surviving cohort of sardine larvae from its original population was analyzed by
backtracking growth curves and compared with the original cohort sampled 2 weeks
earlier in the same nursery site (García et al. 2007). Sardine juveniles sampled and
aged on a monthly basis followed postlarval growing cohorts to their juvenile stages
also indicated that surviving juveniles showed enhanced growth rates (Alemany
et al. 2006).
In conclusion, larval survival of both species is clearly linked to faster growth
rates and better nutritional conditions. Nevertheless, the Alboran Sea sardine can
show two differentiated growth strategies, favoring growth in length or alternatively
in somatic mass (García 2006). The highest larval growth occurred during the
winters of 1995 and 2001. Since the Alboran Sea sardine is a protracted spawner
(early autumn, September to late spring, May), significantly different seasonal
growth patterns occur from winter- to spring-spawned larvae. In general, greater
20,0
6,5
Winter larval cohorts (1995, 1997–1998, 2000–2001, 2003)
Spring larval cohorts (1997–1998, 2000, 2001)
6,0
5,5
5,0
4,5
4,0
3,5
3,0
2,5
19,5
19,0
18,5
18,0
SL (mm)
DW (mg)
17,5
17,0
16,5
C0195 C0297 C0298 C0100
SURVEYS
C0201 C1203
28
RNA VS INCREMENTS: F(4. 484)=150.02, p=0.0000
DNA VS INCREMENTS: F(4. 484)=165.023, p=0.0000
RNA VS INCREMENTS: F(3,287)=48.600, p=0.0000
DNA VS INCREMENTS: F(3,287)=34.546, p=0.0000
SL VS INCREMENTS: F(4,844)=63,751, p=0.0000
DW VS INCREMENTS: F(4,593)=51,650, p=0.0000
SL VS INCREMENTS: F(3.305)=9,6074, p=0.0000
DW VS INCREMENTS: F(3.269)=33,037, p=0.0000
DNA Covariate means:
No Increments: 25.55
RNA
DNA Covariate means:
No Increments: 15.97
RNA
DW Covariate means:
No Increments: 28.55
SL
DW
Covariate means:
No Increments: 15.99635
SL
160
140
120
100
80
60
40
20
26
24
22
20
18
DNA (µg)
RNA (µg)
16
14
12
10
C0195
C0298
C0100
SURVEYS
C0201
C1203
15,0
2,5
2,0
1,5
1,0
0,5
14,5
14,0
SL(mm)
DW (mg)
13,5
13,0
C0497
C0598
C0500
SURVEY
C0401
C0497
C0598
C0500
C0401
20
80
70
60
50
30
40
20
10
0
18
16
14
12
10
8
DNA (µg)
RNA (µg)
6
4
2
0
SURVEY
Fig. 13.15 ANCOVA analysis using estimated age (DI) with somatic variables of size and dry
weight (SL and DW) (left column) and nucleic acid content with age (RNA, DNA) (right column)
(ECOMALAGA time series)
13 Evolving from Fry Fisheries to Early Life Research on Pelagic Fish Resources
509