

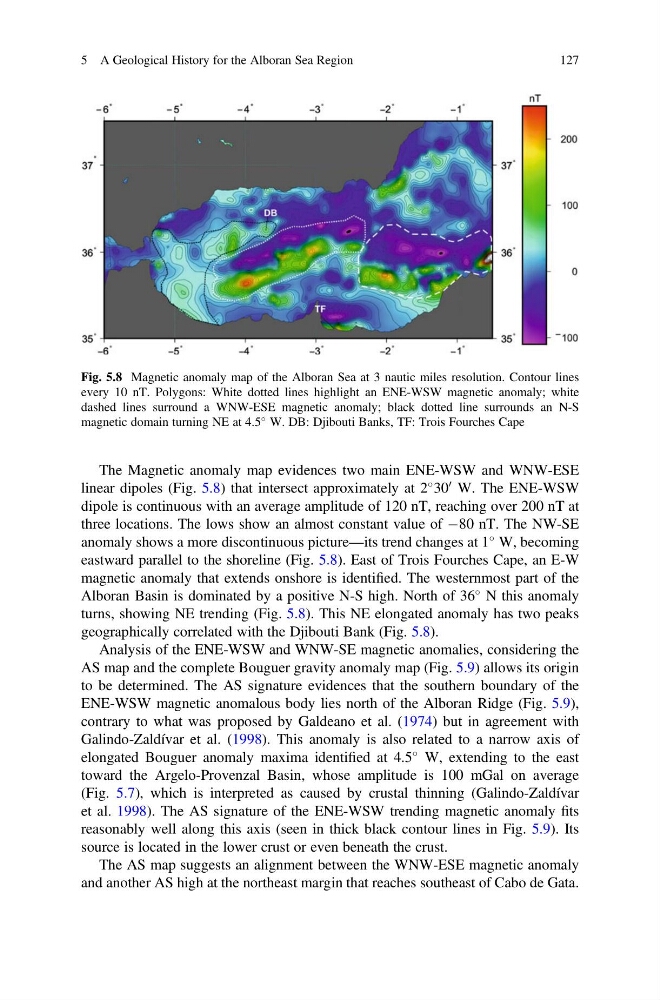
The Magnetic anomaly map evidences two main ENE-WSW and WNW-ESE
linear dipoles (Fig. 5.8) that intersect approximately at 2
30
0 W. The ENE-WSW
dipole is continuous with an average amplitude of 120 nT, reaching over 200 nT at
three locations. The lows show an almost constant value of À80 nT. The NW-SE
anomaly shows a more discontinuous picture—its trend changes at 1
W, becoming
eastward parallel to the shoreline (Fig. 5.8). East of Trois Fourches Cape, an E-W
magnetic anomaly that extends onshore is identified. The westernmost part of the
Alboran Basin is dominated by a positive N-S high. North of 36
N this anomaly
turns, showing NE trending (Fig. 5.8). This NE elongated anomaly has two peaks
geographically correlated with the Djibouti Bank (Fig. 5.8).
Analysis of the ENE-WSW and WNW-SE magnetic anomalies, considering the
AS map and the complete Bouguer gravity anomaly map (Fig. 5.9) allows its origin
to be determined. The AS signature evidences that the southern boundary of the
ENE-WSW magnetic anomalous body lies north of the Alboran Ridge (Fig. 5.9),
contrary to what was proposed by Galdeano et al. (1974) but in agreement with
Galindo-Zaldívar et al. (1998). This anomaly is also related to a narrow axis of
elongated Bouguer anomaly maxima identified at 4.5
W, extending to the east
toward the Argelo-Provenzal Basin, whose amplitude is 100 mGal on average
(Fig. 5.7), which is interpreted as caused by crustal thinning (Galindo-Zaldívar
et al. 1998). The AS signature of the ENE-WSW trending magnetic anomaly fits
reasonably well along this axis (seen in thick black contour lines in Fig. 5.9). Its
source is located in the lower crust or even beneath the crust.
The AS map suggests an alignment between the WNW-ESE magnetic anomaly
and another AS high at the northeast margin that reaches southeast of Cabo de Gata.
Fig. 5.8 Magnetic anomaly map of the Alboran Sea at 3 nautic miles resolution. Contour lines
every 10 nT. Polygons: White dotted lines highlight an ENE-WSW magnetic anomaly; white
dashed lines surround a WNW-ESE magnetic anomaly; black dotted line surrounds an N-S
magnetic domain turning NE at 4.5
W. DB: Djibouti Banks, TF: Trois Fourches Cape
5 A Geological History for the Alboran Sea Region
127
linear dipoles (Fig. 5.8) that intersect approximately at 2
30
0 W. The ENE-WSW
dipole is continuous with an average amplitude of 120 nT, reaching over 200 nT at
three locations. The lows show an almost constant value of À80 nT. The NW-SE
anomaly shows a more discontinuous picture—its trend changes at 1
W, becoming
eastward parallel to the shoreline (Fig. 5.8). East of Trois Fourches Cape, an E-W
magnetic anomaly that extends onshore is identified. The westernmost part of the
Alboran Basin is dominated by a positive N-S high. North of 36
N this anomaly
turns, showing NE trending (Fig. 5.8). This NE elongated anomaly has two peaks
geographically correlated with the Djibouti Bank (Fig. 5.8).
Analysis of the ENE-WSW and WNW-SE magnetic anomalies, considering the
AS map and the complete Bouguer gravity anomaly map (Fig. 5.9) allows its origin
to be determined. The AS signature evidences that the southern boundary of the
ENE-WSW magnetic anomalous body lies north of the Alboran Ridge (Fig. 5.9),
contrary to what was proposed by Galdeano et al. (1974) but in agreement with
Galindo-Zaldívar et al. (1998). This anomaly is also related to a narrow axis of
elongated Bouguer anomaly maxima identified at 4.5
W, extending to the east
toward the Argelo-Provenzal Basin, whose amplitude is 100 mGal on average
(Fig. 5.7), which is interpreted as caused by crustal thinning (Galindo-Zaldívar
et al. 1998). The AS signature of the ENE-WSW trending magnetic anomaly fits
reasonably well along this axis (seen in thick black contour lines in Fig. 5.9). Its
source is located in the lower crust or even beneath the crust.
The AS map suggests an alignment between the WNW-ESE magnetic anomaly
and another AS high at the northeast margin that reaches southeast of Cabo de Gata.
Fig. 5.8 Magnetic anomaly map of the Alboran Sea at 3 nautic miles resolution. Contour lines
every 10 nT. Polygons: White dotted lines highlight an ENE-WSW magnetic anomaly; white
dashed lines surround a WNW-ESE magnetic anomaly; black dotted line surrounds an N-S
magnetic domain turning NE at 4.5
W. DB: Djibouti Banks, TF: Trois Fourches Cape
5 A Geological History for the Alboran Sea Region
127