

52
2 – Methods and techniques
2.1.5 – Physical meaning of complex impedance spectra
By analogy with electric circuits, complex impedance spectra provide the
following information for a conducting material:
2 Re(Z) max = R: sample resistance. Its conductivity σ is obtained from
R
1 S
,
σ =
#
where ℓ and S are the sample thickness and surface area, respectively.
2 Im(Z) max is the maximum phase shift. The equivalent capacitance C is obtained from
C
S
0 R ,
ε ε
=
where ε 0 is the vacuum permittivity (ε 0 = 8.8542 # 10
−12
F m
−1
) and ε R is
the dielectric constant (or relative permittivity) of the sample.
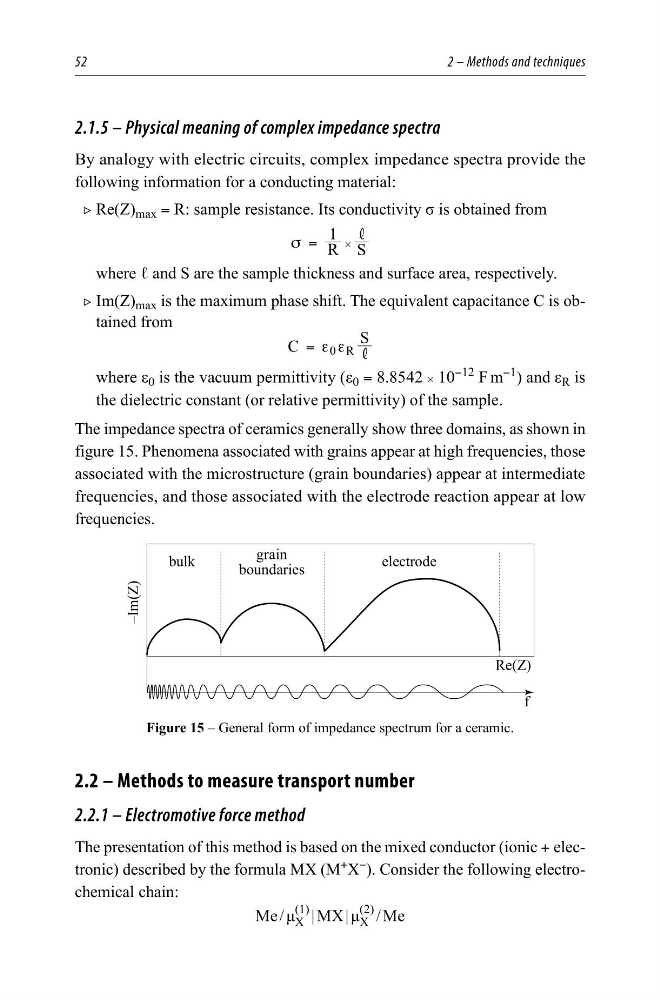
The impedance spectra of ceramics generally show three domains, as shown in
figure 15. Phenomena associated with grains appear at high frequencies, those
associated with the microstructure (grain boundaries) appear at intermediate
frequencies, and those associated with the electrode reaction appear at low
frequencies.
I
5H=
±,P=
HOHFWURGH
JUDLQ
ERXQGDULHV
EXON
Figure 15 – General form of impedance spectrum for a ceramic.
2.2 – Methods to measure transport number
2.2.1 – Electromotive force method
The presentation of this method is based on the mixed conductor (ionic + electronic) described by the formula MX (M
+
X
−
). Consider the following electrochemical chain:
Me / μ X
(1)
| MX | μ X
(2)
/ Me
2 – Methods and techniques
2.1.5 – Physical meaning of complex impedance spectra
By analogy with electric circuits, complex impedance spectra provide the
following information for a conducting material:
2 Re(Z) max = R: sample resistance. Its conductivity σ is obtained from
R
1 S
,
σ =
#
where ℓ and S are the sample thickness and surface area, respectively.
2 Im(Z) max is the maximum phase shift. The equivalent capacitance C is obtained from
C
S
0 R ,
ε ε
=
where ε 0 is the vacuum permittivity (ε 0 = 8.8542 # 10
−12
F m
−1
) and ε R is
the dielectric constant (or relative permittivity) of the sample.
The impedance spectra of ceramics generally show three domains, as shown in
figure 15. Phenomena associated with grains appear at high frequencies, those
associated with the microstructure (grain boundaries) appear at intermediate
frequencies, and those associated with the electrode reaction appear at low
frequencies.
I
5H=
±,P=
HOHFWURGH
JUDLQ
ERXQGDULHV
EXON
Figure 15 – General form of impedance spectrum for a ceramic.
2.2 – Methods to measure transport number
2.2.1 – Electromotive force method
The presentation of this method is based on the mixed conductor (ionic + electronic) described by the formula MX (M
+
X
−
). Consider the following electrochemical chain:
Me / μ X
(1)
| MX | μ X
(2)
/ Me