

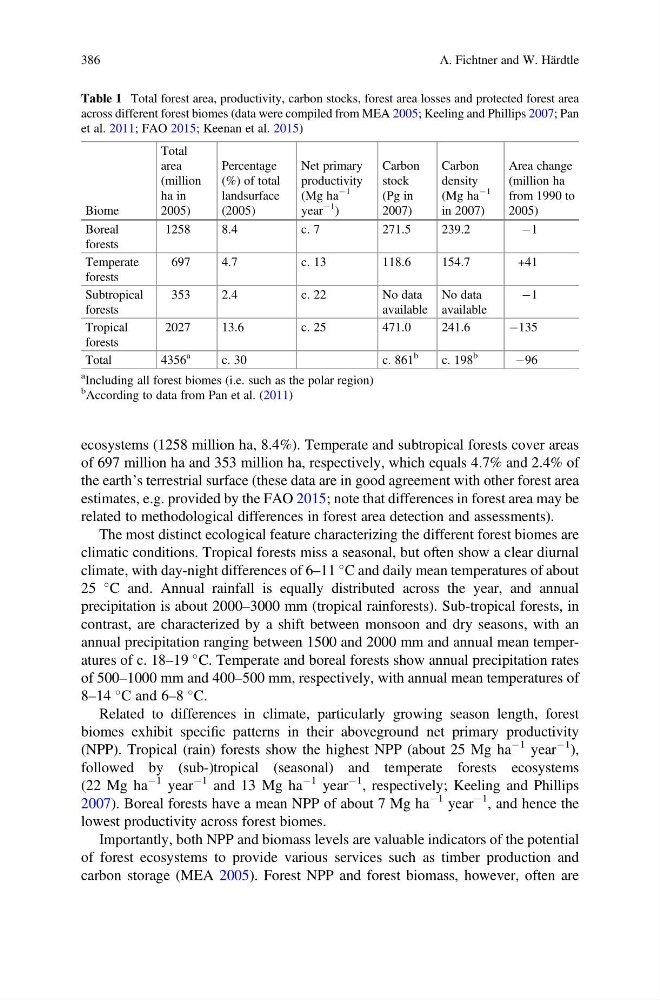
ecosystems (1258 million ha, 8.4%). Temperate and subtropical forests cover areas
of 697 million ha and 353 million ha, respectively, which equals 4.7% and 2.4% of
the earth’s terrestrial surface (these data are in good agreement with other forest area
estimates, e.g. provided by the FAO 2015; note that differences in forest area may be
related to methodological differences in forest area detection and assessments).
The most distinct ecological feature characterizing the different forest biomes are
climatic conditions. Tropical forests miss a seasonal, but often show a clear diurnal
climate, with day-night differences of 6–11
C and daily mean temperatures of about
25
C and. Annual rainfall is equally distributed across the year, and annual
precipitation is about 2000–3000 mm (tropical rainforests). Sub-tropical forests, in
contrast, are characterized by a shift between monsoon and dry seasons, with an
annual precipitation ranging between 1500 and 2000 mm and annual mean temperatures of c. 18–19
C. Temperate and boreal forests show annual precipitation rates
of 500–1000 mm and 400–500 mm, respectively, with annual mean temperatures of
8–14
C and 6–8
C.
Related to differences in climate, particularly growing season length, forest
biomes exhibit specific patterns in their aboveground net primary productivity
(NPP). Tropical (rain) forests show the highest NPP (about 25 Mg ha
À1 year
À1 ),
followed by (sub-)tropical (seasonal) and temperate forests ecosystems
(22 Mg ha
À1 year
À1 and 13 Mg ha
À1 year
À1 , respectively; Keeling and Phillips
2007). Boreal forests have a mean NPP of about 7 Mg ha
À1 year
À1 , and hence the
lowest productivity across forest biomes.
Importantly, both NPP and biomass levels are valuable indicators of the potential
of forest ecosystems to provide various services such as timber production and
carbon storage (MEA 2005). Forest NPP and forest biomass, however, often are
Table 1 Total forest area, productivity, carbon stocks, forest area losses and protected forest area
across different forest biomes (data were compiled from MEA 2005; Keeling and Phillips 2007; Pan
et al. 2011; FAO 2015; Keenan et al. 2015)
Biome
Total
area
(million
ha in
2005)
Percentage
(%) of total
landsurface
(2005)
Net primary
productivity
(Mg ha
À1
year
À1
)
Carbon
stock
(Pg in
2007)
Carbon
density
(Mg ha
À1
in 2007)
Area change
(million ha
from 1990 to
2005)
Boreal
forests
1258
8.4
c. 7
271.5
239.2
À1
Temperate
forests
697
4.7
c. 13
118.6
154.7
+41
Subtropical
forests
353
2.4
c. 22
No data
available
No data
available
À1
Tropical
forests
2027
13.6
c. 25
471.0
241.6
À135
Total
4356
a
c. 30
c. 861
b
c. 198
b
À96
a Including all forest biomes (i.e. such as the polar region)
b
According to data from Pan et al. (2011)
386
A. Fichtner and W. Härdtle
of 697 million ha and 353 million ha, respectively, which equals 4.7% and 2.4% of
the earth’s terrestrial surface (these data are in good agreement with other forest area
estimates, e.g. provided by the FAO 2015; note that differences in forest area may be
related to methodological differences in forest area detection and assessments).
The most distinct ecological feature characterizing the different forest biomes are
climatic conditions. Tropical forests miss a seasonal, but often show a clear diurnal
climate, with day-night differences of 6–11
C and daily mean temperatures of about
25
C and. Annual rainfall is equally distributed across the year, and annual
precipitation is about 2000–3000 mm (tropical rainforests). Sub-tropical forests, in
contrast, are characterized by a shift between monsoon and dry seasons, with an
annual precipitation ranging between 1500 and 2000 mm and annual mean temperatures of c. 18–19
C. Temperate and boreal forests show annual precipitation rates
of 500–1000 mm and 400–500 mm, respectively, with annual mean temperatures of
8–14
C and 6–8
C.
Related to differences in climate, particularly growing season length, forest
biomes exhibit specific patterns in their aboveground net primary productivity
(NPP). Tropical (rain) forests show the highest NPP (about 25 Mg ha
À1 year
À1 ),
followed by (sub-)tropical (seasonal) and temperate forests ecosystems
(22 Mg ha
À1 year
À1 and 13 Mg ha
À1 year
À1 , respectively; Keeling and Phillips
2007). Boreal forests have a mean NPP of about 7 Mg ha
À1 year
À1 , and hence the
lowest productivity across forest biomes.
Importantly, both NPP and biomass levels are valuable indicators of the potential
of forest ecosystems to provide various services such as timber production and
carbon storage (MEA 2005). Forest NPP and forest biomass, however, often are
Table 1 Total forest area, productivity, carbon stocks, forest area losses and protected forest area
across different forest biomes (data were compiled from MEA 2005; Keeling and Phillips 2007; Pan
et al. 2011; FAO 2015; Keenan et al. 2015)
Biome
Total
area
(million
ha in
2005)
Percentage
(%) of total
landsurface
(2005)
Net primary
productivity
(Mg ha
À1
year
À1
)
Carbon
stock
(Pg in
2007)
Carbon
density
(Mg ha
À1
in 2007)
Area change
(million ha
from 1990 to
2005)
Boreal
forests
1258
8.4
c. 7
271.5
239.2
À1
Temperate
forests
697
4.7
c. 13
118.6
154.7
+41
Subtropical
forests
353
2.4
c. 22
No data
available
No data
available
À1
Tropical
forests
2027
13.6
c. 25
471.0
241.6
À135
Total
4356
a
c. 30
c. 861
b
c. 198
b
À96
a Including all forest biomes (i.e. such as the polar region)
b
According to data from Pan et al. (2011)
386
A. Fichtner and W. Härdtle